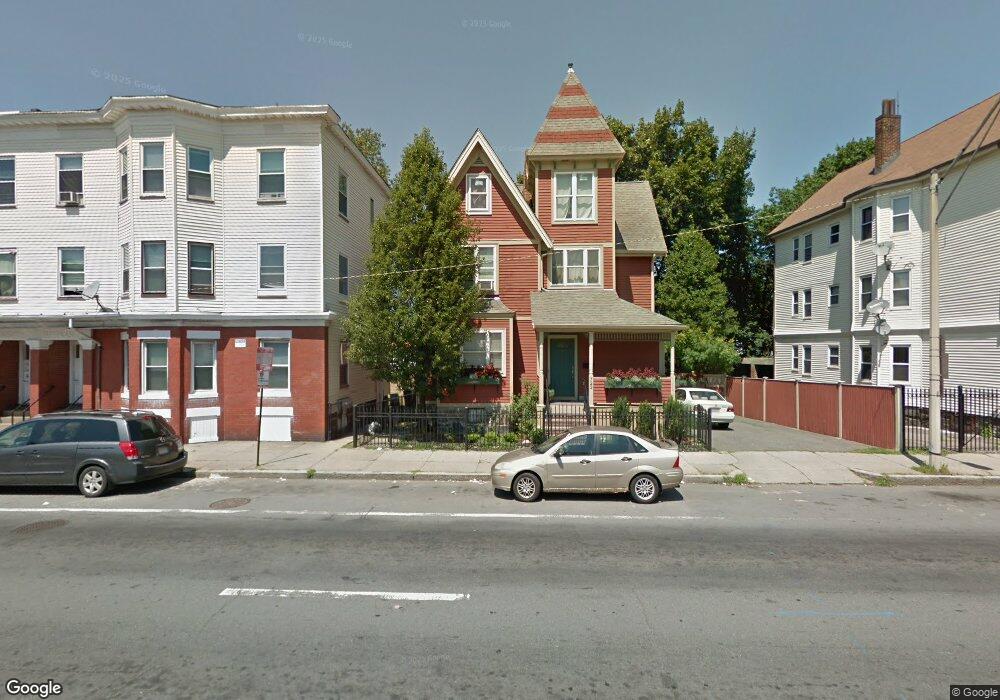
722 Morton St Mattapan, MA 02126
Franklin Field South NeighborhoodEstimated Value: $620,000 - $709,000
5
Beds
2
Baths
2,589
Sq Ft
$256/Sq Ft
Est. Value
About This Home
This home is located at 722 Morton St, Mattapan, MA 02126 and is currently estimated at $663,156, approximately $256 per square foot. 722 Morton St is a home located in Suffolk County with nearby schools including KIPP Academy Boston Charter School and Berea Seventh-day Adventist Academy.
Ownership History
Date
Name
Owned For
Owner Type
Purchase Details
Closed on
Aug 10, 2010
Sold by
Bolling Marion P
Bought by
Bolling Marion P and Bolling Royal L
Current Estimated Value
Home Financials for this Owner
Home Financials are based on the most recent Mortgage that was taken out on this home.
Original Mortgage
$0
Interest Rate
4.49%
Create a Home Valuation Report for This Property
The Home Valuation Report is an in-depth analysis detailing your home's value as well as a comparison with similar homes in the area
Home Values in the Area
Average Home Value in this Area
Purchase History
| Date | Buyer | Sale Price | Title Company |
|---|---|---|---|
| Bolling Marion P | -- | -- |
Source: Public Records
Mortgage History
| Date | Status | Borrower | Loan Amount |
|---|---|---|---|
| Closed | Bolling Marion P | $0 |
Source: Public Records
Tax History Compared to Growth
Tax History
| Year | Tax Paid | Tax Assessment Tax Assessment Total Assessment is a certain percentage of the fair market value that is determined by local assessors to be the total taxable value of land and additions on the property. | Land | Improvement |
|---|---|---|---|---|
| 2025 | $5,931 | $512,200 | $180,500 | $331,700 |
| 2024 | $5,328 | $488,800 | $168,000 | $320,800 |
| 2023 | $5,001 | $465,600 | $160,000 | $305,600 |
| 2022 | $4,606 | $423,300 | $145,500 | $277,800 |
| 2021 | $4,280 | $401,100 | $142,600 | $258,500 |
| 2020 | $3,698 | $350,200 | $128,800 | $221,400 |
| 2019 | $3,691 | $350,200 | $110,200 | $240,000 |
| 2018 | $3,495 | $333,500 | $110,200 | $223,300 |
| 2017 | $3,332 | $314,600 | $110,200 | $204,400 |
| 2016 | $3,296 | $299,600 | $110,200 | $189,400 |
| 2015 | $3,055 | $252,300 | $82,000 | $170,300 |
| 2014 | $3,174 | $252,300 | $82,000 | $170,300 |
Source: Public Records
Map
Nearby Homes
- 6 Deering Rd
- 67 Wildwood St
- 5 Sutton St
- 5 Sutton St Unit 3B
- 27 Havelock St
- 29 Havelock St
- 10 Sutton St
- 24 Marden Ave
- 10 Hosmer St
- 17 Greendale Rd Unit 2F
- 69 Lucerne St
- 14 Estella St Unit 2
- 28 Hansborough St Unit 2
- 28 Hansborough St Unit 5
- 21 Ashton St Unit 1
- 492 Harvard St
- 30-32 Westmore Rd
- 68 Mascot St
- 38 Mascot St Unit 3
- 14 Fabyan St
- 720 Morton St Unit 1
- 720 Morton St Unit 2
- 724 Morton St
- 724 Morton St Unit 1
- 718 Morton St Unit 2
- 718 Morton St Unit 1 and 2
- 718 Morton St
- 718 Morton St Unit 6
- 728 Morton St
- 728 Morton St Unit 2
- 732 Morton St
- 725 Morton St Unit 3
- 725 Morton St
- 729 Morton St
- 729 Morton St Unit 2
- 733 Morton St
- 736 Morton St
- 741 Morton St
- 5 Livingstone St
- 11 Livingstone St