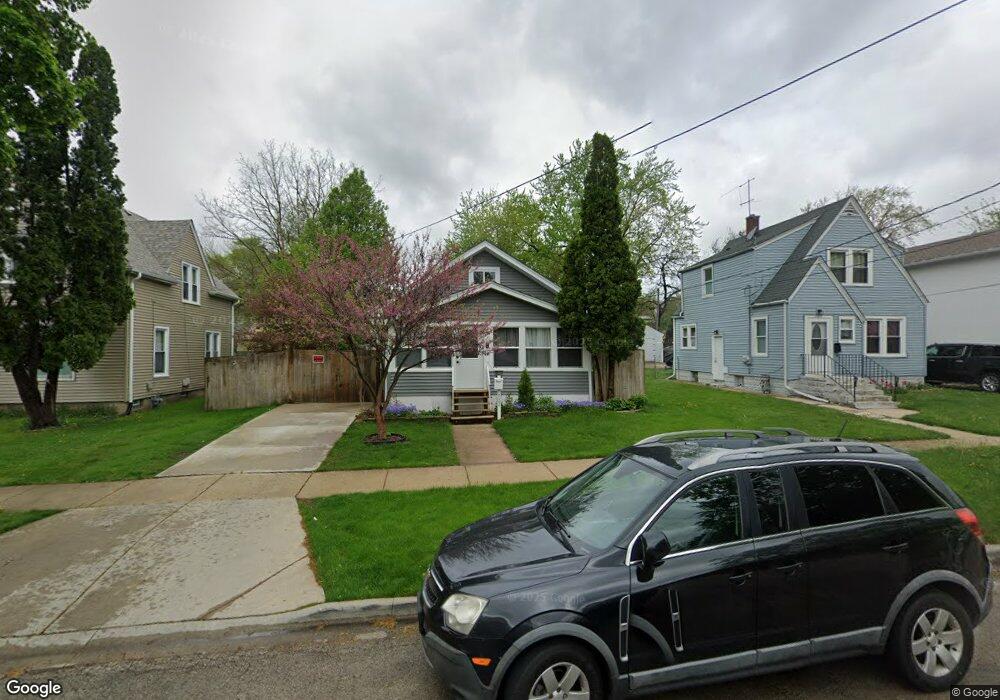
722 N View St Aurora, IL 60506
North River NeighborhoodEstimated Value: $193,000 - $217,000
2
Beds
1
Bath
768
Sq Ft
$265/Sq Ft
Est. Value
About This Home
This home is located at 722 N View St, Aurora, IL 60506 and is currently estimated at $203,370, approximately $264 per square foot. 722 N View St is a home located in Kane County with nearby schools including Hill Elementary School, Herget Middle School, and West Aurora High School.
Ownership History
Date
Name
Owned For
Owner Type
Purchase Details
Closed on
Aug 23, 2006
Sold by
Drew Mason Llc
Bought by
Flores Esteban and Flores Maria Griselda
Current Estimated Value
Home Financials for this Owner
Home Financials are based on the most recent Mortgage that was taken out on this home.
Original Mortgage
$111,000
Interest Rate
7.12%
Mortgage Type
Purchase Money Mortgage
Purchase Details
Closed on
Sep 27, 2004
Sold by
Taylor Olivia F and Taylor Samuel J
Bought by
Drew Mason Llc
Create a Home Valuation Report for This Property
The Home Valuation Report is an in-depth analysis detailing your home's value as well as a comparison with similar homes in the area
Home Values in the Area
Average Home Value in this Area
Purchase History
| Date | Buyer | Sale Price | Title Company |
|---|---|---|---|
| Flores Esteban | $125,000 | Regent Title Ins Agency Llc | |
| Drew Mason Llc | $27,500 | Regent Title |
Source: Public Records
Mortgage History
| Date | Status | Borrower | Loan Amount |
|---|---|---|---|
| Previous Owner | Flores Esteban | $111,000 |
Source: Public Records
Tax History
| Year | Tax Paid | Tax Assessment Tax Assessment Total Assessment is a certain percentage of the fair market value that is determined by local assessors to be the total taxable value of land and additions on the property. | Land | Improvement |
|---|---|---|---|---|
| 2024 | $3,588 | $45,317 | $7,955 | $37,362 |
| 2023 | $3,468 | $40,491 | $7,108 | $33,383 |
| 2022 | $3,270 | $36,944 | $6,485 | $30,459 |
| 2021 | $3,143 | $34,396 | $6,038 | $28,358 |
| 2020 | $2,991 | $31,948 | $5,608 | $26,340 |
| 2019 | $2,959 | $30,261 | $5,196 | $25,065 |
| 2018 | $2,952 | $29,571 | $4,806 | $24,765 |
| 2017 | $2,873 | $27,916 | $4,428 | $23,488 |
| 2016 | $2,642 | $24,869 | $3,796 | $21,073 |
| 2015 | -- | $21,520 | $3,264 | $18,256 |
| 2014 | -- | $19,996 | $3,140 | $16,856 |
| 2013 | -- | $20,403 | $3,095 | $17,308 |
Source: Public Records
Map
Nearby Homes
- 418 W Illinois Ave
- 603 N May St
- 519 N View St
- 523 N Highland Ave
- 355 Lawndale Ave
- 415 Blackhawk St
- 507 W Park Ave
- 509 N Park Ave
- 837 Taylor Ave
- 514 Spruce St
- 424 N Lancaster Ave
- 1060 N Highland Ave
- 1062 N Highland Ave
- 109 N May St
- 932 W New York St
- 847 Foran Ln
- 14-18 N Lake St
- 231-233 Williams St
- 338 Lakelawn Blvd
- 359 W Galena Blvd
Your Personal Tour Guide
Ask me questions while you tour the home.