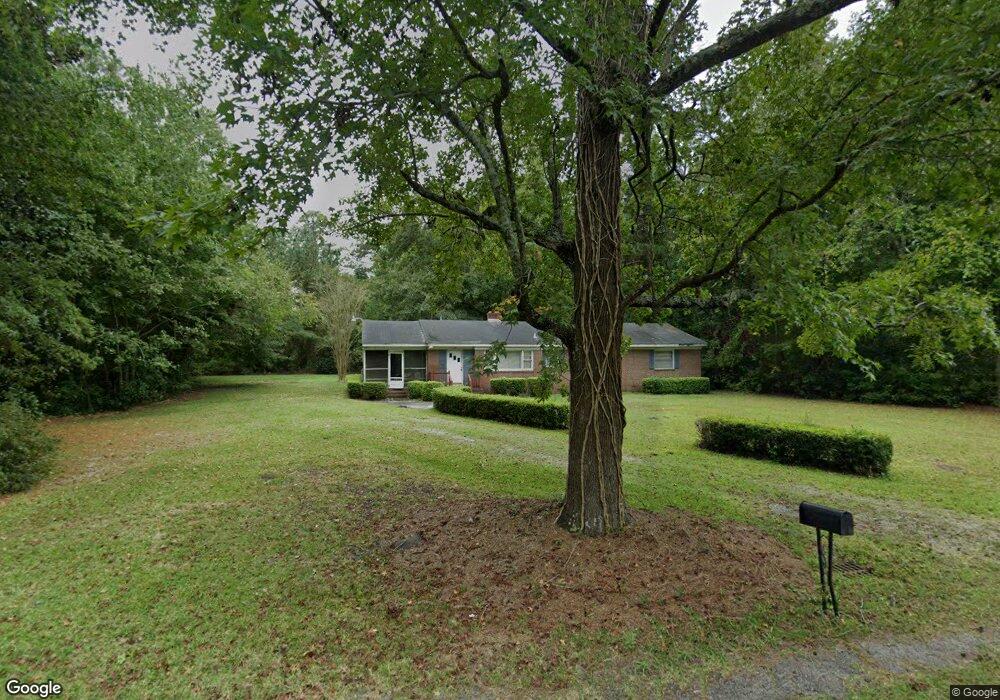
722 Piner Rd Wilmington, NC 28409
Estimated Value: $296,000 - $436,000
2
Beds
2
Baths
1,607
Sq Ft
$210/Sq Ft
Est. Value
About This Home
This home is located at 722 Piner Rd, Wilmington, NC 28409 and is currently estimated at $337,550, approximately $210 per square foot. 722 Piner Rd is a home located in New Hanover County with nearby schools including Heyward C. Bellamy Elementary School, Myrtle Grove Middle School, and Eugene Ashley High School.
Ownership History
Date
Name
Owned For
Owner Type
Purchase Details
Closed on
Jan 11, 2024
Sold by
Lunsford Mary M
Bought by
Myrtle Grove Presbyterian Church
Current Estimated Value
Purchase Details
Closed on
Jan 26, 2009
Sold by
Carrick Mary Mercelle and Lunsford Mary M
Bought by
Lunsford Mary M
Home Financials for this Owner
Home Financials are based on the most recent Mortgage that was taken out on this home.
Original Mortgage
$259,500
Interest Rate
2.18%
Mortgage Type
Reverse Mortgage Home Equity Conversion Mortgage
Purchase Details
Closed on
May 23, 1979
Sold by
Batson Elizabeth Bender
Bought by
Carrick Mercelle M
Purchase Details
Closed on
Dec 8, 1971
Sold by
Carrick Kenneth E
Bought by
Carrick Mercelle Mattews
Purchase Details
Closed on
Jan 26, 1960
Sold by
Batson Sidney L Elizabeth
Bought by
Carrick Kenneth E Mary Mercelle
Create a Home Valuation Report for This Property
The Home Valuation Report is an in-depth analysis detailing your home's value as well as a comparison with similar homes in the area
Home Values in the Area
Average Home Value in this Area
Purchase History
| Date | Buyer | Sale Price | Title Company |
|---|---|---|---|
| Myrtle Grove Presbyterian Church | -- | None Listed On Document | |
| Myrtle Grove Presbyterian Church | $257,500 | None Listed On Document | |
| Lunsford Mary M | $500 | None Available | |
| Carrick Mercelle M | $2,500 | -- | |
| Carrick Mercelle Mattews | -- | -- | |
| Carrick Kenneth E Mary Mercelle | $500 | -- |
Source: Public Records
Mortgage History
| Date | Status | Borrower | Loan Amount |
|---|---|---|---|
| Previous Owner | Lunsford Mary M | $259,500 |
Source: Public Records
Tax History Compared to Growth
Tax History
| Year | Tax Paid | Tax Assessment Tax Assessment Total Assessment is a certain percentage of the fair market value that is determined by local assessors to be the total taxable value of land and additions on the property. | Land | Improvement |
|---|---|---|---|---|
| 2025 | $1,001 | $356,200 | $148,300 | $207,900 |
| 2023 | $942 | $166,200 | $83,600 | $82,600 |
| 2022 | $467 | $166,200 | $83,600 | $82,600 |
| 2021 | $467 | $166,200 | $83,600 | $82,600 |
| 2020 | $475 | $150,300 | $52,200 | $98,100 |
| 2019 | $475 | $150,300 | $52,200 | $98,100 |
| 2018 | $475 | $150,300 | $52,200 | $98,100 |
| 2017 | $487 | $150,300 | $52,200 | $98,100 |
| 2016 | $487 | $140,500 | $51,800 | $88,700 |
| 2015 | $452 | $140,500 | $51,800 | $88,700 |
| 2014 | $445 | $140,500 | $51,800 | $88,700 |
Source: Public Records
Map
Nearby Homes
- 633 Piner Rd
- 5705 Woodduck Cir
- 5610 Carolina Beach Rd Unit 13
- 234 Brighton Rd
- 301 Foxwood Ln
- 273 Foxwood Ln
- 5427 Ellen Dale Place Unit (Lot 45)
- 5109 Old Myrtle Grove Rd
- 804 Tisbury Ln
- 5613 Swiss Stone Ct
- 5415 Ellen Dale Place Unit (Lot 42)
- 5500 N Warrendale Ct
- 5014 Helms Port Ave
- 5531 Fayes Meadow Ct Unit (Lot 8)
- 1202 Beresford Ct
- 5353 Leisure Cir
- 5004 Laurenbridge Ln
- 5028 Laurenbridge Ln
- 4922 Woods Edge Rd
- 5613 Onyx Ct
- 714 Piner Rd
- 735 Piner Rd
- 721 Piner Rd
- 5768 Highgrove Place
- 5765 Highgrove Place
- 5764 Highgrove Place
- 801 Piner Rd
- 5761 Highgrove Place
- 5760 Highgrove Place
- 5757 Highgrove Place
- 805 Piner Rd
- 814 Piner Rd
- 5756 Highgrove Place
- 817 Piner Rd
- 5753 Highgrove Place
- 5752 Highgrove Place
- 641 Piner Rd
- 905 Hazel Bill Ct
- 5749 Highgrove Place
- 712 Duck Downe Ct