Estimated Value: $528,000 - $553,000
5
Beds
3
Baths
2,340
Sq Ft
$229/Sq Ft
Est. Value
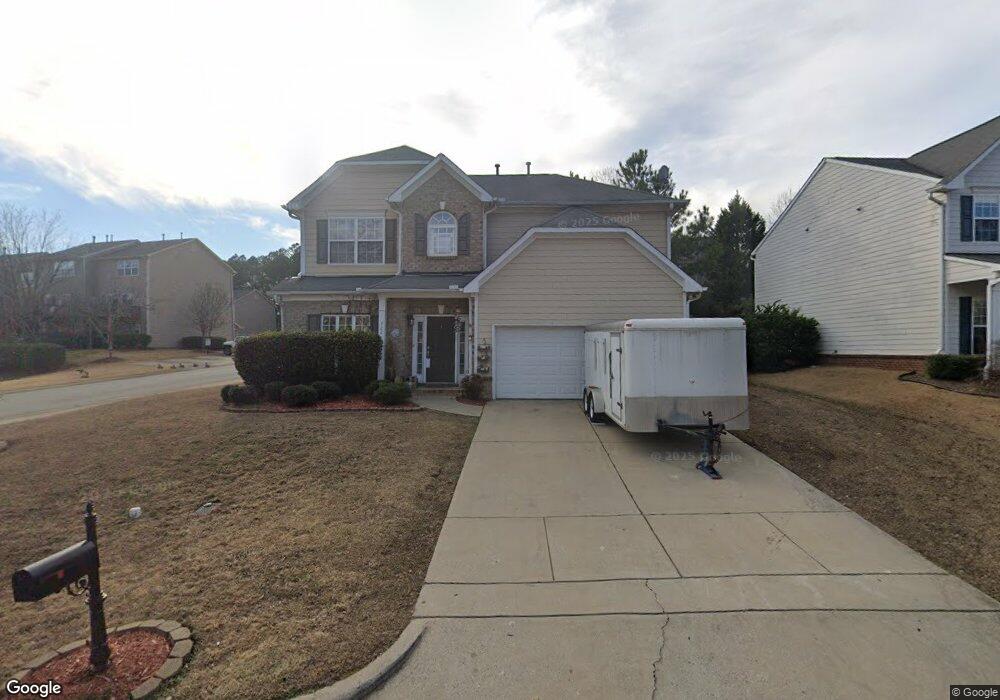
About This Home
This home is located at 722 Straywhite Ave, Apex, NC 27539 and is currently estimated at $535,490, approximately $228 per square foot. 722 Straywhite Ave is a home located in Wake County with nearby schools including Lufkin Road Middle School, Apex Friendship High School, and Pine Springs Prep Academy.
Ownership History
Date
Name
Owned For
Owner Type
Purchase Details
Closed on
Aug 25, 2016
Sold by
Price Theodor and Price Faith E
Bought by
Price Theodor and Price Faith E
Current Estimated Value
Purchase Details
Closed on
Jul 18, 2012
Sold by
Deangelo Samuel J and Deangelo Kristin B
Bought by
Price Theodor and Price Faith E
Home Financials for this Owner
Home Financials are based on the most recent Mortgage that was taken out on this home.
Original Mortgage
$165,000
Outstanding Balance
$114,059
Interest Rate
3.7%
Mortgage Type
New Conventional
Estimated Equity
$421,431
Purchase Details
Closed on
Jun 26, 2006
Sold by
Mccar Homes Raleigh Llc
Bought by
Deangelo Samuel J and Deangelo Kristin B
Home Financials for this Owner
Home Financials are based on the most recent Mortgage that was taken out on this home.
Original Mortgage
$52,600
Interest Rate
9%
Mortgage Type
Stand Alone Second
Create a Home Valuation Report for This Property
The Home Valuation Report is an in-depth analysis detailing your home's value as well as a comparison with similar homes in the area
Purchase History
| Date | Buyer | Sale Price | Title Company |
|---|---|---|---|
| Price Theodor | -- | None Available | |
| Price Theodor | $235,000 | None Available | |
| Deangelo Samuel J | $263,500 | None Available |
Source: Public Records
Mortgage History
| Date | Status | Borrower | Loan Amount |
|---|---|---|---|
| Open | Price Theodor | $165,000 | |
| Previous Owner | Deangelo Samuel J | $52,600 | |
| Previous Owner | Deangelo Samuel J | $210,450 |
Source: Public Records
Tax History
| Year | Tax Paid | Tax Assessment Tax Assessment Total Assessment is a certain percentage of the fair market value that is determined by local assessors to be the total taxable value of land and additions on the property. | Land | Improvement |
|---|---|---|---|---|
| 2025 | $4,209 | $479,783 | $130,000 | $349,783 |
| 2024 | $4,115 | $479,783 | $130,000 | $349,783 |
Source: Public Records
Map
Nearby Homes
- 102 Gallent Hedge Trail
- 3468 Colby Chase Dr
- 2727 Dilly Dally Ct
- 3332 Colby Chase Dr Unit Lot 3
- 3340 Colby Chase Dr Unit Lot 2
- 680 Wickham Ridge Rd
- 694 Wickham Ridge Rd
- 314 Cabana Dr
- 5417 Bobbitt Rd
- 5501 Bobbitt Rd
- 825 Wickham Ridge Rd
- 2353 Horton Park Dr
- 2344 Horton Park Dr
- 2345 Horton Park Dr
- 2340 Horton Park Dr
- 2341 Horton Park Dr
- 2332 Horton Park Dr
- 2333 Horton Park Dr
- 5712 Mosley Ave
- 133 Florians Dr
- 720 Straywhite Ave
- 104 Forrymast Trail
- 100 Forrymast Trail
- 718 Straywhite Ave
- 106 Forrymast Trail
- 100 Gallent Hedge Trail
- 723 Straywhite Ave
- 725 Straywhite Ave
- 721 Straywhite Ave
- 110 Forrymast Trail
- 104 Gallent Hedge Trail
- 716 Straywhite Ave
- 719 Straywhite Ave
- 106 Gallent Hedge Trail
- 112 Forrymast Trail
- 201 Storemont Way
- 114 Forrymast Trail
- 108 Gallent Hedge Trail
- 203 Storemont Way
- 717 Straywhite Ave
Your Personal Tour Guide
Ask me questions while you tour the home.