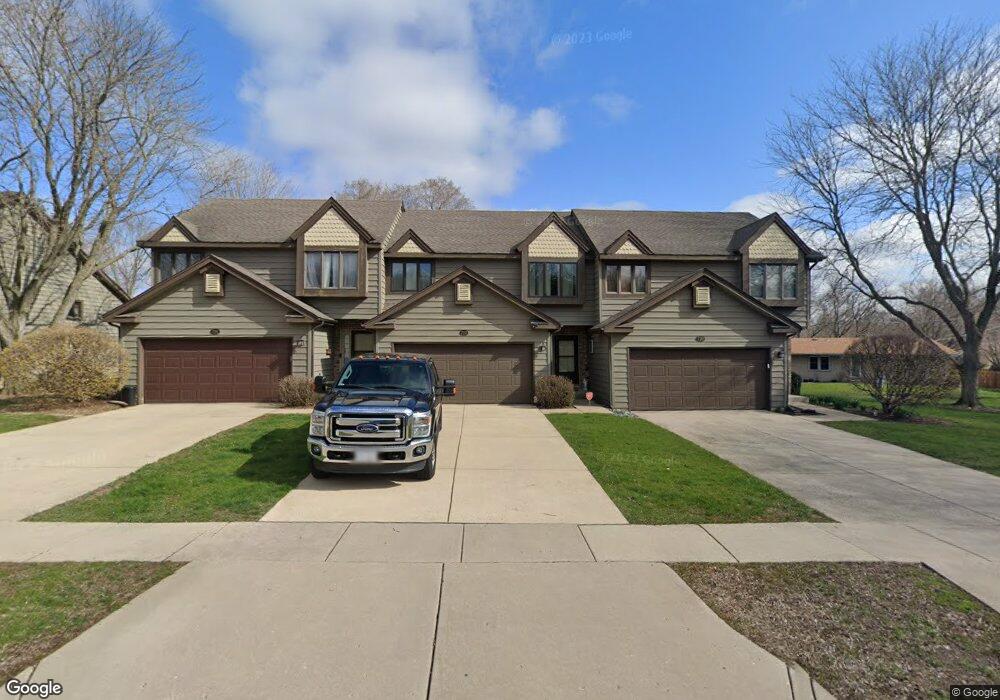
722 Strom Dr West Dundee, IL 60118
Estimated Value: $261,753 - $301,000
2
Beds
2
Baths
1,572
Sq Ft
$181/Sq Ft
Est. Value
About This Home
This home is located at 722 Strom Dr, West Dundee, IL 60118 and is currently estimated at $285,188, approximately $181 per square foot. 722 Strom Dr is a home located in Kane County with nearby schools including Dundee Highlands Elementary School, Dundee Middle School, and Dundee-Crown High School.
Ownership History
Date
Name
Owned For
Owner Type
Purchase Details
Closed on
Dec 8, 2016
Sold by
Miedema Nancy
Bought by
Schultz Kaden
Current Estimated Value
Home Financials for this Owner
Home Financials are based on the most recent Mortgage that was taken out on this home.
Original Mortgage
$85,700
Outstanding Balance
$68,968
Interest Rate
3.75%
Mortgage Type
New Conventional
Estimated Equity
$216,220
Purchase Details
Closed on
Dec 19, 2008
Sold by
Werner Stanley J and Werner Wendy J
Bought by
Miedema Karen J
Home Financials for this Owner
Home Financials are based on the most recent Mortgage that was taken out on this home.
Original Mortgage
$97,500
Interest Rate
6.19%
Mortgage Type
Purchase Money Mortgage
Purchase Details
Closed on
Sep 17, 1996
Sold by
Werner Stanley J
Bought by
Werner Stanley J and Werner Wendy J
Create a Home Valuation Report for This Property
The Home Valuation Report is an in-depth analysis detailing your home's value as well as a comparison with similar homes in the area
Home Values in the Area
Average Home Value in this Area
Purchase History
| Date | Buyer | Sale Price | Title Company |
|---|---|---|---|
| Schultz Kaden | -- | Premier Title | |
| Miedema Karen J | $185,000 | Chicago Title Insurance Co | |
| Werner Stanley J | -- | -- |
Source: Public Records
Mortgage History
| Date | Status | Borrower | Loan Amount |
|---|---|---|---|
| Open | Schultz Kaden | $85,700 | |
| Previous Owner | Miedema Karen J | $97,500 |
Source: Public Records
Tax History
| Year | Tax Paid | Tax Assessment Tax Assessment Total Assessment is a certain percentage of the fair market value that is determined by local assessors to be the total taxable value of land and additions on the property. | Land | Improvement |
|---|---|---|---|---|
| 2024 | $4,967 | $68,932 | $8,371 | $60,561 |
| 2023 | $4,623 | $62,023 | $7,532 | $54,491 |
| 2022 | $4,759 | $60,015 | $7,532 | $52,483 |
| 2021 | $4,578 | $56,666 | $7,112 | $49,554 |
| 2020 | $4,488 | $55,392 | $6,952 | $48,440 |
| 2019 | $4,330 | $52,584 | $6,600 | $45,984 |
| 2018 | $4,009 | $48,036 | $6,469 | $41,567 |
| 2017 | $3,798 | $44,935 | $6,051 | $38,884 |
| 2016 | $3,861 | $43,508 | $5,859 | $37,649 |
| 2015 | -- | $40,768 | $5,490 | $35,278 |
| 2014 | -- | $39,642 | $5,338 | $34,304 |
| 2013 | -- | $42,503 | $5,501 | $37,002 |
Source: Public Records
Map
Nearby Homes
- 560 S 5th St
- 601 Edwards Ave
- 505 Ryan Ln
- 601 S 2nd St
- Lot 1 View St
- 315 Liberty St
- 1042 Chateau Bluff Ln
- 305 Oregon Ave
- 706 Geneva St
- 206 Water St
- 408 Jackson St
- 36 River Ridge Dr
- 842 Winmoor Dr
- 436 Barrington Ave
- 10 Chateau Dr
- 103 Rainbow Dr
- 820 Lindsay Ln
- 716 Surrey Ln
- 605 Barrington Ave Unit 140
- 605 Barrington Ave Unit 208
- 720 Strom Dr
- 724 Strom Dr
- 726 Strom Dr
- 728 Strom Dr
- 668 S 7th St
- 672 S 7th St
- 664 S 7th St
- 730 Strom Dr
- 717 Strom Dr Unit 3D
- 717 Strom Dr Unit 1B
- 717 Strom Dr Unit 2A
- 717 Strom Dr Unit 2C
- 717 Strom Dr Unit 2D
- 717 Strom Dr Unit 3B
- 717 Strom Dr Unit 1A
- 717 Strom Dr Unit 1C
- 717 Strom Dr
- 717 Strom Dr Unit 1D
- 717 Strom Dr Unit 3A
- 717 Strom Dr Unit 2B
Your Personal Tour Guide
Ask me questions while you tour the home.