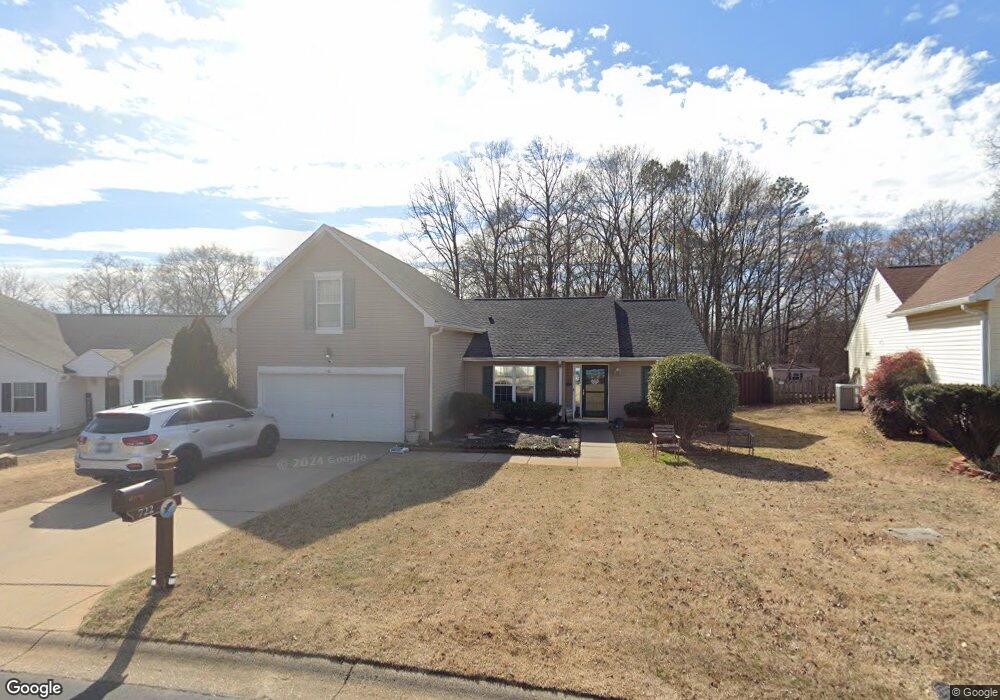
722 Thornbird Cir Boiling Springs, SC 29316
Estimated Value: $261,000 - $295,000
3
Beds
2
Baths
1,750
Sq Ft
$159/Sq Ft
Est. Value
About This Home
This home is located at 722 Thornbird Cir, Boiling Springs, SC 29316 and is currently estimated at $277,927, approximately $158 per square foot. 722 Thornbird Cir is a home located in Spartanburg County with nearby schools including Boiling Springs Elementary School, Rainbow Lake Middle School, and Boiling Springs High School.
Ownership History
Date
Name
Owned For
Owner Type
Purchase Details
Closed on
Mar 25, 2022
Sold by
Spingler Brenda J
Bought by
Spingler Brenda J and Spinger Joseph L
Current Estimated Value
Purchase Details
Closed on
Jul 7, 2021
Sold by
Smith Amy S
Bought by
Spingler Brenda J
Purchase Details
Closed on
Jan 29, 2019
Sold by
Akers William G
Bought by
Spinguer Brenda J W and Smith Amy S
Purchase Details
Closed on
Jan 29, 2018
Sold by
Akers William G
Bought by
Smith Brenda J and Smith Amy S
Purchase Details
Closed on
Jul 10, 2015
Sold by
Akers Margo E and Akers William G
Bought by
Akers William G and Akers Margo E
Home Financials for this Owner
Home Financials are based on the most recent Mortgage that was taken out on this home.
Original Mortgage
$5,000
Interest Rate
5%
Mortgage Type
Stand Alone Second
Purchase Details
Closed on
Aug 20, 2003
Sold by
Carter Lindsey Derek E and Carter Lindsey Amanda
Bought by
Akers William G and Akers Margo E
Create a Home Valuation Report for This Property
The Home Valuation Report is an in-depth analysis detailing your home's value as well as a comparison with similar homes in the area
Home Values in the Area
Average Home Value in this Area
Purchase History
| Date | Buyer | Sale Price | Title Company |
|---|---|---|---|
| Spingler Brenda J | -- | None Listed On Document | |
| Spingler Brenda J | -- | None Listed On Document | |
| Spingler Brenda J | -- | None Available | |
| Spinguer Brenda J W | -- | None Available | |
| Smith Brenda J | -- | None Available | |
| Akers William G | -- | -- | |
| Akers William G | -- | -- | |
| Akers William G | $125,000 | -- |
Source: Public Records
Mortgage History
| Date | Status | Borrower | Loan Amount |
|---|---|---|---|
| Previous Owner | Akers William G | $5,000 | |
| Previous Owner | Akers William G | $54,703 |
Source: Public Records
Tax History Compared to Growth
Tax History
| Year | Tax Paid | Tax Assessment Tax Assessment Total Assessment is a certain percentage of the fair market value that is determined by local assessors to be the total taxable value of land and additions on the property. | Land | Improvement |
|---|---|---|---|---|
| 2025 | $1,283 | $7,544 | $1,009 | $6,535 |
| 2024 | $1,283 | $7,544 | $1,009 | $6,535 |
| 2023 | $1,283 | $7,544 | $1,009 | $6,535 |
| 2022 | $1,144 | $6,560 | $780 | $5,780 |
| 2021 | $1,142 | $6,560 | $780 | $5,780 |
| 2020 | $736 | $6,173 | $734 | $5,439 |
| 2019 | $736 | $6,173 | $734 | $5,439 |
| 2018 | $719 | $6,173 | $734 | $5,439 |
| 2017 | $595 | $5,368 | $780 | $4,588 |
| 2016 | $599 | $5,368 | $780 | $4,588 |
| 2015 | $595 | $5,368 | $780 | $4,588 |
| 2014 | $585 | $5,368 | $780 | $4,588 |
Source: Public Records
Map
Nearby Homes
- 125 Condor Place
- 5082 Sunnycreek Dr
- 5085 Sunnycreek Dr
- 5086 Sunnycreek Dr
- 5090 Sunnycreek Dr
- 5077 Sunnycreek Dr
- 5081 Sunnycreek Dr
- 133 Valley Creek Dr
- 242 Birds Eye View
- 864 Thornbird Cir
- Crestfall II Plan at Hazelwood
- Glenwood II Plan at Hazelwood
- Laurel II Plan at Hazelwood
- Bentcreek II Plan at Hazelwood
- Hidden Creek II Plan at Hazelwood
- 808 Cecelia Dr
- 0 Cecelia Drive - Lot 1
- 517 Tilgate Ct
- 775 Overton Ridge Way
- 768 Sterling Dr
- 718 Thornbird Cir
- 724 Thornbird Cir
- 108 Oriole Ct
- 723 Thornbird Cir
- 715 Thornbird Cir
- 708 Thornbird Cir
- 289 Birds Eye View
- 290 Birds Eye View
- 103 Oriole Ct
- 114 Oriole Ct
- 709 Thornbird Cir
- 739 Thornbird Cir
- 702 Thornbird Cir
- 283 Birds Eye View
- 703 Thornbird Cir
- 109 Oriole Ct
- 749 Thornbird Cir
- 284 Birds Eye View
- 115 Oriole Ct
- 736 Thornbird Cir