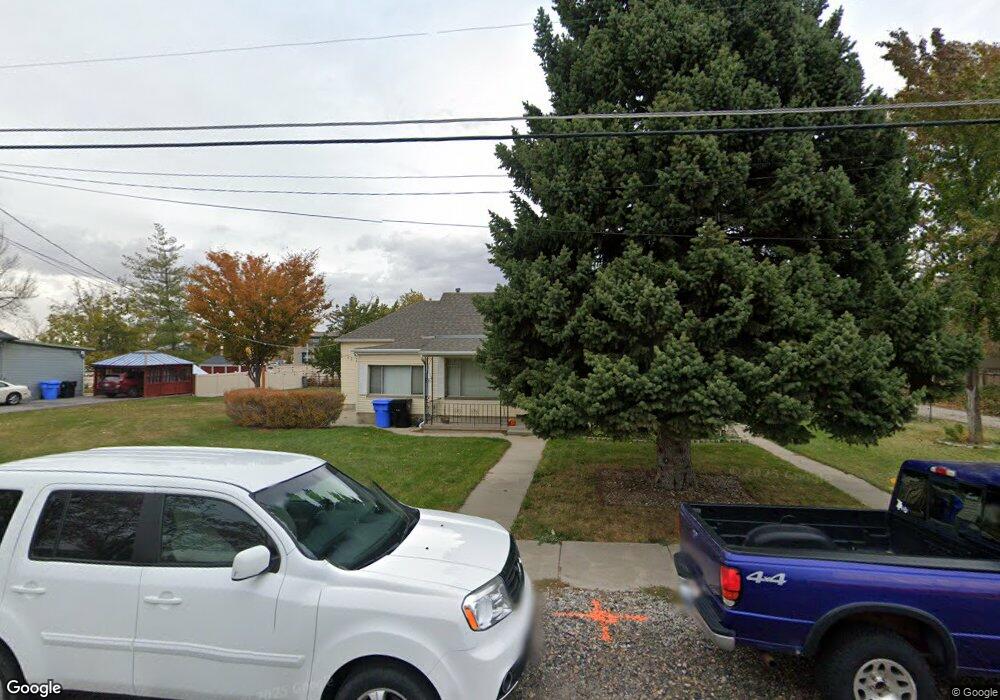
722 W 400 N West Bountiful, UT 84087
Estimated Value: $653,000 - $820,000
4
Beds
2
Baths
2,619
Sq Ft
$271/Sq Ft
Est. Value
About This Home
This home is located at 722 W 400 N, West Bountiful, UT 84087 and is currently estimated at $710,825, approximately $271 per square foot. 722 W 400 N is a home located in Davis County with nearby schools including West Bountiful Elementary School, Bountiful Junior High School, and Viewmont High School.
Ownership History
Date
Name
Owned For
Owner Type
Purchase Details
Closed on
Oct 3, 2019
Sold by
Murphy Heather
Bought by
Thomson Olin Parker and Thomson Kindra
Current Estimated Value
Home Financials for this Owner
Home Financials are based on the most recent Mortgage that was taken out on this home.
Original Mortgage
$407,915
Outstanding Balance
$351,753
Interest Rate
2.87%
Mortgage Type
FHA
Estimated Equity
$359,072
Purchase Details
Closed on
Mar 31, 2017
Sold by
Murphy Ronald Curtis
Bought by
Murphy Heather
Home Financials for this Owner
Home Financials are based on the most recent Mortgage that was taken out on this home.
Original Mortgage
$290,400
Interest Rate
3.94%
Mortgage Type
New Conventional
Purchase Details
Closed on
Nov 8, 2011
Sold by
The Secretary Of Housing & Urban Develop
Bought by
Murphy Ronald Curtis
Home Financials for this Owner
Home Financials are based on the most recent Mortgage that was taken out on this home.
Original Mortgage
$161,727
Interest Rate
4.4%
Mortgage Type
FHA
Purchase Details
Closed on
May 28, 2010
Sold by
Bac Home Loans Servicing Lp
Bought by
Secretary Of Housing & Urban Development
Purchase Details
Closed on
May 20, 2008
Sold by
Chambers Lindsey R
Bought by
Chambers Joshua and Chambers Lindsey R
Home Financials for this Owner
Home Financials are based on the most recent Mortgage that was taken out on this home.
Original Mortgage
$251,817
Interest Rate
5.88%
Mortgage Type
New Conventional
Purchase Details
Closed on
Sep 11, 2007
Sold by
Mccormick Lex C and Mccormick Shelly J
Bought by
Chambers Lindsey R and Chambers Joshua
Home Financials for this Owner
Home Financials are based on the most recent Mortgage that was taken out on this home.
Original Mortgage
$242,500
Interest Rate
6.67%
Mortgage Type
Purchase Money Mortgage
Purchase Details
Closed on
Aug 9, 2002
Sold by
Alder Larson R and Alder Jolie C
Bought by
Mccormick Lex C and Mccormick Shelly J
Home Financials for this Owner
Home Financials are based on the most recent Mortgage that was taken out on this home.
Original Mortgage
$151,620
Interest Rate
6.51%
Mortgage Type
FHA
Purchase Details
Closed on
Apr 16, 1997
Sold by
Ranck Byron and Ranck Isabella S
Bought by
Alder Larson R and Alder Julie C
Home Financials for this Owner
Home Financials are based on the most recent Mortgage that was taken out on this home.
Original Mortgage
$80,000
Interest Rate
7.86%
Mortgage Type
Balloon
Create a Home Valuation Report for This Property
The Home Valuation Report is an in-depth analysis detailing your home's value as well as a comparison with similar homes in the area
Home Values in the Area
Average Home Value in this Area
Purchase History
| Date | Buyer | Sale Price | Title Company |
|---|---|---|---|
| Thomson Olin Parker | -- | Northern Title Co | |
| Murphy Heather | -- | -- | |
| Murphy Ronald Curtis | -- | Monument Title Ins In | |
| Secretary Of Housing & Urban Development | -- | Security Title Ins Agency | |
| Bac Home Loans Servicing Lp | $261,327 | Security Title Ins Agency | |
| Chambers Joshua | -- | Utah Commercial Title Co | |
| Chambers Lindsey R | -- | Utah Commercial Title Co | |
| Chambers Lindsey R | -- | Mountain View Title & Escr | |
| Mccormick Lex C | -- | Bonneville Title Company Inc | |
| Alder Larson R | -- | Associated Title Company |
Source: Public Records
Mortgage History
| Date | Status | Borrower | Loan Amount |
|---|---|---|---|
| Open | Thomson Olin Parker | $407,915 | |
| Previous Owner | Murphy Heather | $290,400 | |
| Previous Owner | Murphy Ronald Curtis | $161,727 | |
| Previous Owner | Chambers Lindsey R | $251,817 | |
| Previous Owner | Chambers Lindsey R | $242,500 | |
| Previous Owner | Mccormick Lex C | $151,620 | |
| Previous Owner | Alder Larson R | $80,000 |
Source: Public Records
Tax History Compared to Growth
Tax History
| Year | Tax Paid | Tax Assessment Tax Assessment Total Assessment is a certain percentage of the fair market value that is determined by local assessors to be the total taxable value of land and additions on the property. | Land | Improvement |
|---|---|---|---|---|
| 2025 | $3,734 | $300,850 | $223,326 | $77,524 |
| 2024 | $3,501 | $291,499 | $186,605 | $104,894 |
| 2023 | $3,335 | $282,700 | $182,807 | $99,892 |
| 2022 | $3,398 | $294,251 | $176,116 | $118,135 |
| 2021 | $3,227 | $429,000 | $272,313 | $156,687 |
| 2020 | $2,732 | $354,000 | $225,097 | $128,903 |
| 2019 | $2,613 | $335,000 | $207,348 | $127,652 |
| 2018 | $2,366 | $296,000 | $180,451 | $115,549 |
| 2016 | $1,977 | $136,345 | $78,352 | $57,993 |
| 2015 | $1,928 | $128,095 | $78,352 | $49,743 |
| 2014 | $1,864 | $129,171 | $78,352 | $50,819 |
| 2013 | -- | $102,985 | $49,985 | $53,000 |
Source: Public Records
Map
Nearby Homes
- 767 W 220 N
- 340 N 500 W Unit 204
- 790 N 500 W
- 399 W 400 N Unit 47
- 680 W 500 S Unit 22
- 680 W 500 S Unit 17
- 280 N 1100 W
- 825 W 1320 N
- 366 W 1000 N
- 167 S 425 W
- 314 W Center St Unit D159
- 314 W Center St Unit E150
- 499 N 200 W Unit 30
- 499 N 200 W Unit 19
- 75 N Peregrine Ln W Unit 8
- 553 N 200 W
- 131 W 25 N Unit 4
- 147 W 25 N Unit 5
- 184 Park Shadows Cir
- 810 Park Shadows Cir