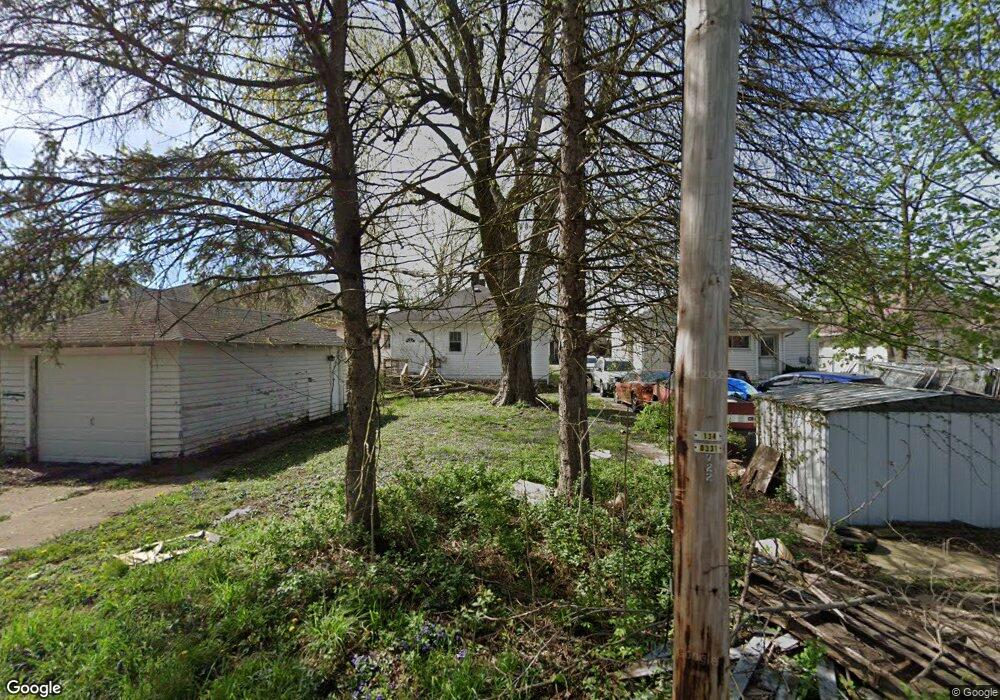
722 W 4th St Anderson, IN 46016
Estimated Value: $50,000 - $96,005
2
Beds
1
Bath
1,120
Sq Ft
$64/Sq Ft
Est. Value
About This Home
This home is located at 722 W 4th St, Anderson, IN 46016 and is currently estimated at $72,001, approximately $64 per square foot. 722 W 4th St is a home located in Madison County with nearby schools including Eastside Elementary School, Highland Middle School, and Anderson High School.
Ownership History
Date
Name
Owned For
Owner Type
Purchase Details
Closed on
Jan 18, 2024
Sold by
Anafi Yehonatan and Broudo Yoav
Bought by
Y & Yin Llc
Current Estimated Value
Home Financials for this Owner
Home Financials are based on the most recent Mortgage that was taken out on this home.
Original Mortgage
$168,350
Interest Rate
6.9%
Mortgage Type
New Conventional
Purchase Details
Closed on
Sep 7, 2022
Sold by
Set Sail Investments Llc
Bought by
Anafi Yehonatan and Broudo Yoav
Purchase Details
Closed on
Mar 11, 2020
Sold by
L & S Properties Of Indiana Llc
Bought by
Set Sail Investments Llc
Purchase Details
Closed on
Jan 30, 2015
Sold by
Brown Lisa Reynolds
Bought by
L & S Properties Of Indiana Ll
Purchase Details
Closed on
Dec 29, 2009
Sold by
Secretary Of Hud
Bought by
Reynolds Brown Lisa
Purchase Details
Closed on
Jun 19, 2009
Sold by
Midfirst Bank
Bought by
Secretary Of Hud
Create a Home Valuation Report for This Property
The Home Valuation Report is an in-depth analysis detailing your home's value as well as a comparison with similar homes in the area
Home Values in the Area
Average Home Value in this Area
Purchase History
| Date | Buyer | Sale Price | Title Company |
|---|---|---|---|
| Y & Yin Llc | -- | None Listed On Document | |
| Anafi Yehonatan | $41,200 | -- | |
| Set Sail Investments Llc | -- | None Available | |
| L & S Properties Of Indiana Ll | -- | -- | |
| Reynolds Brown Lisa | -- | -- | |
| Secretary Of Hud | -- | -- | |
| Midfirst Bank | $60,805 | -- |
Source: Public Records
Mortgage History
| Date | Status | Borrower | Loan Amount |
|---|---|---|---|
| Previous Owner | Y & Yin Llc | $168,350 |
Source: Public Records
Tax History Compared to Growth
Tax History
| Year | Tax Paid | Tax Assessment Tax Assessment Total Assessment is a certain percentage of the fair market value that is determined by local assessors to be the total taxable value of land and additions on the property. | Land | Improvement |
|---|---|---|---|---|
| 2024 | $931 | $41,900 | $6,600 | $35,300 |
| 2023 | $617 | $27,600 | $6,300 | $21,300 |
| 2022 | $613 | $27,400 | $5,900 | $21,500 |
| 2021 | $547 | $24,300 | $5,900 | $18,400 |
| 2020 | $524 | $23,200 | $5,600 | $17,600 |
| 2019 | $511 | $22,600 | $5,600 | $17,000 |
| 2018 | $485 | $21,000 | $5,600 | $15,400 |
| 2017 | $414 | $20,700 | $5,600 | $15,100 |
| 2016 | $414 | $20,700 | $5,600 | $15,100 |
| 2014 | $396 | $19,800 | $6,300 | $13,500 |
| 2013 | $396 | $37,600 | $6,300 | $31,300 |
Source: Public Records
Map
Nearby Homes