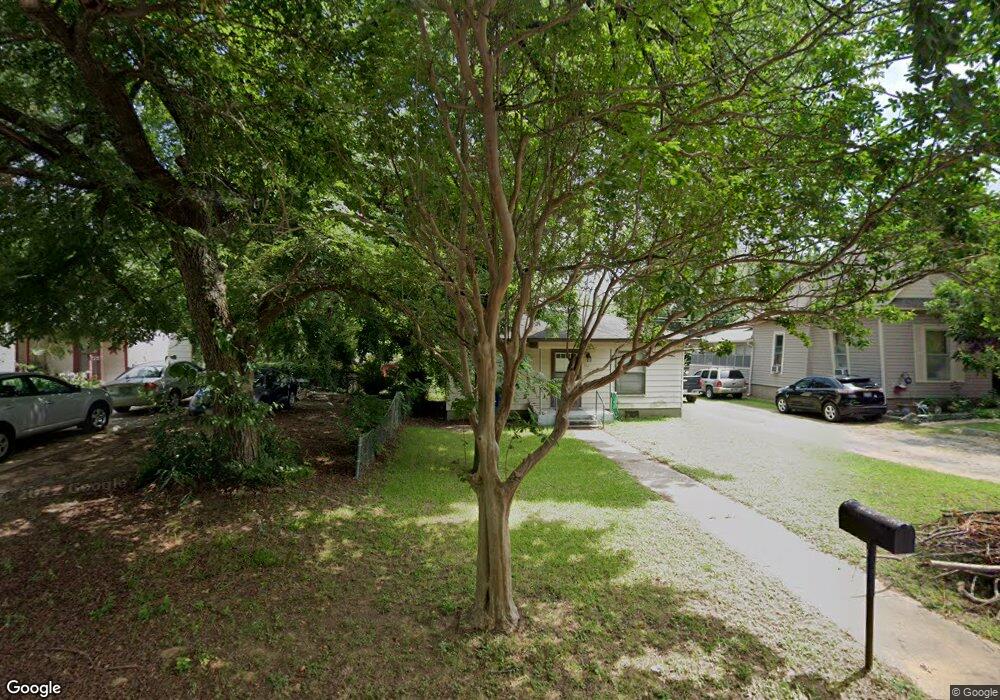
722 W Hanna St Denison, TX 75020
Estimated Value: $128,000 - $130,604
2
Beds
1
Bath
840
Sq Ft
$154/Sq Ft
Est. Value
About This Home
This home is located at 722 W Hanna St, Denison, TX 75020 and is currently estimated at $129,302, approximately $153 per square foot. 722 W Hanna St is a home located in Grayson County with nearby schools including Scott Middle School, Denison High School, and St. Luke's Parish Day School.
Ownership History
Date
Name
Owned For
Owner Type
Purchase Details
Closed on
Jul 17, 2019
Sold by
Texoma S & D Properties Inc
Bought by
Calderon Selena
Current Estimated Value
Home Financials for this Owner
Home Financials are based on the most recent Mortgage that was taken out on this home.
Original Mortgage
$68,500
Interest Rate
3.5%
Mortgage Type
Purchase Money Mortgage
Purchase Details
Closed on
Jun 28, 2019
Sold by
Traweek Larry Joe
Bought by
Texoma S & D Propeties Inc and S & D Properties
Home Financials for this Owner
Home Financials are based on the most recent Mortgage that was taken out on this home.
Original Mortgage
$68,500
Interest Rate
3.5%
Mortgage Type
Purchase Money Mortgage
Purchase Details
Closed on
Oct 17, 2006
Sold by
Traweek Lonnie and Traweek Mary Elizabeth
Bought by
Traweek Larry Joe
Create a Home Valuation Report for This Property
The Home Valuation Report is an in-depth analysis detailing your home's value as well as a comparison with similar homes in the area
Home Values in the Area
Average Home Value in this Area
Purchase History
| Date | Buyer | Sale Price | Title Company |
|---|---|---|---|
| Calderon Selena | -- | None Available | |
| Texoma S & D Propeties Inc | -- | Grayson County Title | |
| Sahmburger Mary Ann | -- | Grayson County Title | |
| Traweek Mary Elizabeth | -- | Grayson County Title | |
| Traweek Larry Joe | -- | None Available |
Source: Public Records
Mortgage History
| Date | Status | Borrower | Loan Amount |
|---|---|---|---|
| Previous Owner | Calderon Selena | $68,500 |
Source: Public Records
Tax History Compared to Growth
Tax History
| Year | Tax Paid | Tax Assessment Tax Assessment Total Assessment is a certain percentage of the fair market value that is determined by local assessors to be the total taxable value of land and additions on the property. | Land | Improvement |
|---|---|---|---|---|
| 2025 | $2,232 | $105,230 | $43,800 | $61,430 |
| 2024 | $2,232 | $96,078 | $32,700 | $63,378 |
| 2023 | $2,299 | $101,476 | $38,400 | $63,076 |
| 2022 | $1,954 | $82,250 | $24,000 | $58,250 |
| 2021 | $1,627 | $64,514 | $13,500 | $51,014 |
| 2020 | $1,678 | $63,624 | $13,500 | $50,124 |
| 2019 | $1,611 | $58,550 | $8,340 | $50,210 |
| 2018 | $1,501 | $54,124 | $6,600 | $47,524 |
| 2017 | $1,355 | $48,449 | $4,380 | $44,069 |
| 2016 | $1,205 | $43,082 | $4,380 | $38,702 |
| 2015 | $0 | $32,115 | $4,380 | $27,735 |
| 2014 | -- | $32,115 | $4,380 | $27,735 |
Source: Public Records
Map
Nearby Homes
- 736 W Bullock St
- 2560 S Scullin Ave
- 709 W Hanna St
- 617 W Bullock St
- 908 W Murray St
- 1016 W Hanna St
- 1023 W Bullock St
- 1301 S Scullin Ave
- 525 W Hanna St
- 1031 W Acheson St
- 517 W Bullock St
- 509 W Acheson St
- 513 W Murray St
- 708 W Texas St
- 928 W Chase St
- TBD W Texas St
- 1401 W Texas St
- 0000 W Texas St
- 1044 W Ford St
- 1210 W Bullock St
- 724 W Hanna St
- 712 W Hanna St
- 730 W Hanna St
- 719 W Bullock St
- 732 W Hanna St
- 721 W Bullock St
- 708 W Hanna St
- 715 W Bullock St
- 731 W Hanna St
- 723 W Bullock St
- 734 W Hanna St
- 721 W Hanna St
- 705 W Bullock St
- 725 W Bullock St
- 717 W Hanna St
- 704 W Hanna St
- 715 W Hanna St
- 727 W Bullock St
- 701 W Bullock St
- 705 W Hanna St