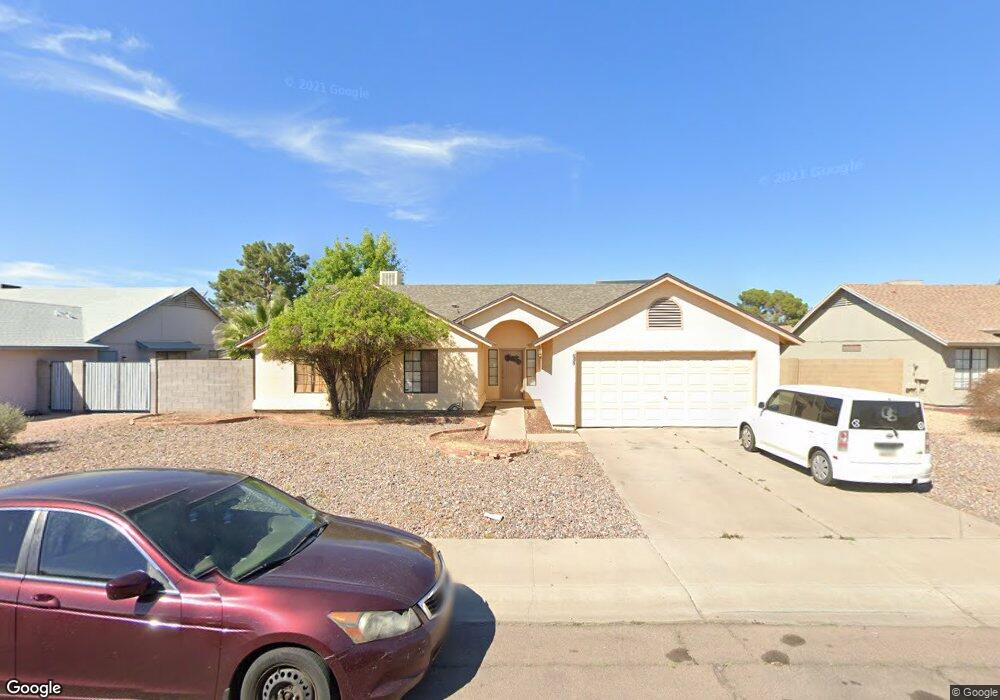
722 W Loughlin Dr Chandler, AZ 85225
Amberwood NeighborhoodEstimated Value: $460,256 - $548,000
--
Bed
3
Baths
1,917
Sq Ft
$263/Sq Ft
Est. Value
About This Home
This home is located at 722 W Loughlin Dr, Chandler, AZ 85225 and is currently estimated at $503,314, approximately $262 per square foot. 722 W Loughlin Dr is a home located in Maricopa County with nearby schools including Sirrine Elementary School, Franklin at Brimhall Elementary School, and Summit Academy Elementary.
Ownership History
Date
Name
Owned For
Owner Type
Purchase Details
Closed on
Dec 16, 2005
Sold by
Fleck Terry
Bought by
Fleck #11 Properties Llc
Current Estimated Value
Purchase Details
Closed on
Nov 19, 2004
Sold by
Garcia Kimberly A and Garcia Jody
Bought by
Fleck Terry
Home Financials for this Owner
Home Financials are based on the most recent Mortgage that was taken out on this home.
Original Mortgage
$163,624
Interest Rate
4.19%
Mortgage Type
Negative Amortization
Purchase Details
Closed on
Feb 1, 2002
Sold by
Do Ming Hao and Do Jennifer Siu Ou Man
Bought by
Garcia Jody and Garcia Kimberly A
Home Financials for this Owner
Home Financials are based on the most recent Mortgage that was taken out on this home.
Original Mortgage
$142,500
Interest Rate
7.17%
Mortgage Type
New Conventional
Create a Home Valuation Report for This Property
The Home Valuation Report is an in-depth analysis detailing your home's value as well as a comparison with similar homes in the area
Home Values in the Area
Average Home Value in this Area
Purchase History
| Date | Buyer | Sale Price | Title Company |
|---|---|---|---|
| Fleck #11 Properties Llc | -- | -- | |
| Fleck Terry | $204,530 | Capital Title Agency Inc | |
| Garcia Jody | $150,000 | Security Title Agency |
Source: Public Records
Mortgage History
| Date | Status | Borrower | Loan Amount |
|---|---|---|---|
| Previous Owner | Fleck Terry | $163,624 | |
| Previous Owner | Garcia Jody | $142,500 |
Source: Public Records
Tax History Compared to Growth
Tax History
| Year | Tax Paid | Tax Assessment Tax Assessment Total Assessment is a certain percentage of the fair market value that is determined by local assessors to be the total taxable value of land and additions on the property. | Land | Improvement |
|---|---|---|---|---|
| 2025 | $2,065 | $20,469 | -- | -- |
| 2024 | $2,069 | $19,495 | -- | -- |
| 2023 | $2,069 | $37,560 | $7,510 | $30,050 |
| 2022 | $2,017 | $28,180 | $5,630 | $22,550 |
| 2021 | $2,005 | $26,170 | $5,230 | $20,940 |
| 2020 | $1,982 | $24,260 | $4,850 | $19,410 |
| 2019 | $1,843 | $22,560 | $4,510 | $18,050 |
| 2018 | $1,794 | $20,900 | $4,180 | $16,720 |
| 2017 | $1,730 | $19,580 | $3,910 | $15,670 |
| 2016 | $1,692 | $19,080 | $3,810 | $15,270 |
| 2015 | $1,586 | $17,070 | $3,410 | $13,660 |
Source: Public Records
Map
Nearby Homes
- 2712 N Evergreen St
- 800 W Marlboro Dr
- 916 W Loughlin Dr
- 2609 N Pleasant Dr
- 812 W Rosal Place
- 3009 N Pleasant Dr
- 305 W Nopal Place
- 792 W El Monte Place Unit 8
- 617 W Chilton St
- 2940 N Oregon St Unit 9
- 2954 N Oregon St Unit 6
- 307 W El Prado Rd
- 1224 W Mesquite St
- 2970 N Oregon St Unit 10
- 1203 W Alamo Dr
- 286 W Palomino Dr Unit 147
- 286 W Palomino Dr Unit 99
- 286 W Palomino Dr Unit 75
- 286 W Palomino Dr Unit 85
- 286 W Palomino Dr Unit 83
- 724 W Loughlin Dr
- 720 W Loughlin Dr
- 723 W Cheyenne Dr
- 725 W Cheyenne Dr Unit 2
- 726 W Loughlin Dr
- 718 W Loughlin Dr
- 721 W Loughlin Dr
- 721 W Cheyenne Dr
- 719 W Loughlin Dr
- 723 W Loughlin Dr
- 727 W Cheyenne Dr
- 717 W Loughlin Dr
- 719 W Cheyenne Dr
- 716 W Loughlin Dr
- 725 W Loughlin Dr
- 715 W Loughlin Dr
- 716 W Mission Dr
- 718 W Mission Dr
- 717 W Cheyenne Dr
- 714 W Mission Dr