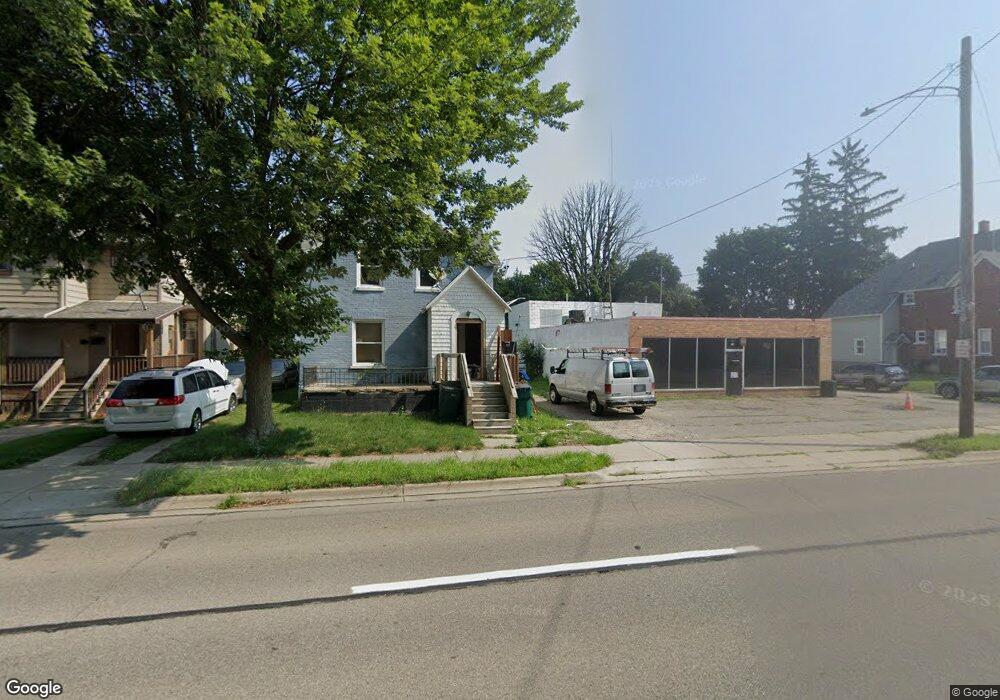
722 W Saginaw St Lansing, MI 48915
Old Forest NeighborhoodEstimated Value: $34,781 - $150,000
7
Beds
2
Baths
1,868
Sq Ft
$45/Sq Ft
Est. Value
About This Home
This home is located at 722 W Saginaw St, Lansing, MI 48915 and is currently estimated at $83,195, approximately $44 per square foot. 722 W Saginaw St is a home located in Ingham County with nearby schools including Riddle Elementary School, Pattengill Academy, and J.W. Sexton High School.
Ownership History
Date
Name
Owned For
Owner Type
Purchase Details
Closed on
May 16, 2025
Sold by
Smith Nick
Bought by
Grit Michigan Llc
Current Estimated Value
Purchase Details
Closed on
Feb 21, 2025
Sold by
King Denise Kay
Bought by
Smith Nick
Purchase Details
Closed on
Aug 15, 2023
Sold by
King Bucky J
Bought by
King Denise Kay
Purchase Details
Closed on
Sep 16, 2011
Sold by
Munro Pam and Munro Paul
Bought by
Kiig Bucky Joe
Purchase Details
Closed on
Oct 6, 2004
Sold by
Park Lawrence A and Park Mary E
Bought by
Munro Paul D and Munro Pamela K
Home Financials for this Owner
Home Financials are based on the most recent Mortgage that was taken out on this home.
Original Mortgage
$61,100
Interest Rate
4.46%
Mortgage Type
Purchase Money Mortgage
Purchase Details
Closed on
Jul 6, 1998
Sold by
Vadnais Gregory J and Vadnais Celeste
Bought by
Park Mary E and Park Lawrence A
Create a Home Valuation Report for This Property
The Home Valuation Report is an in-depth analysis detailing your home's value as well as a comparison with similar homes in the area
Home Values in the Area
Average Home Value in this Area
Purchase History
| Date | Buyer | Sale Price | Title Company |
|---|---|---|---|
| Grit Michigan Llc | -- | None Listed On Document | |
| Smith Nick | $33,500 | Elevate Title | |
| King Denise Kay | $60,698 | Elevate Title | |
| King Denise Kay | -- | None Listed On Document | |
| Kiig Bucky Joe | -- | None Available | |
| Munro Paul D | $47,400 | Bell Title Company | |
| Munro Paul D | -- | Bell Title Co | |
| Munro Paul D | $47,400 | Bell Title Company | |
| Munro Paul D | -- | Bell Title Co | |
| Park Mary E | $36,000 | -- |
Source: Public Records
Mortgage History
| Date | Status | Borrower | Loan Amount |
|---|---|---|---|
| Previous Owner | Munro Paul D | $61,100 |
Source: Public Records
Tax History
| Year | Tax Paid | Tax Assessment Tax Assessment Total Assessment is a certain percentage of the fair market value that is determined by local assessors to be the total taxable value of land and additions on the property. | Land | Improvement |
|---|---|---|---|---|
| 2025 | $2,590 | $49,000 | $5,400 | $43,600 |
| 2024 | $26 | $37,600 | $5,400 | $32,200 |
| 2023 | $2,200 | $33,700 | $5,400 | $28,300 |
| 2022 | $2,008 | $31,300 | $5,100 | $26,200 |
| 2021 | $1,964 | $29,000 | $4,800 | $24,200 |
| 2020 | $1,950 | $26,300 | $4,800 | $21,500 |
| 2019 | $1,876 | $24,600 | $4,800 | $19,800 |
| 2018 | $1,812 | $25,600 | $4,800 | $20,800 |
| 2017 | $1,737 | $25,600 | $4,800 | $20,800 |
| 2016 | $1,665 | $25,100 | $4,800 | $20,300 |
| 2015 | $1,665 | $24,400 | $9,590 | $14,810 |
| 2014 | $1,665 | $23,600 | $12,000 | $11,600 |
Source: Public Records
Map
Nearby Homes
- 733 N Pine St
- 745 Chicago Ave
- 705 Princeton Ave
- 921 N Sycamore St
- 820 Princeton Ave
- 425 N Sycamore St
- 734 N Martin Luther King jr Blvd
- 925 N Pine St
- 814 N Martin Luther King jr Blvd
- 733 N Walnut St
- 919 Princeton Ave
- 1017 W Genesee St
- 325 N Sycamore St
- 1019 Daleford Ave
- 416 N Martin Luther King Junior Blvd
- 1109 S Genesee Dr
- 312 W Saginaw St Unit 1
- 312 N Butler Blvd
- 1217 W Saginaw St
- 908 Clyde St
- 726 W Saginaw St Unit 1
- 710 Wisconsin Ave
- 716 Wisconsin Ave
- 706 W Saginaw St
- 706 W Saginaw St Unit 2
- 706 W Saginaw St Unit 1
- 715 N Sycamore St
- 722 Wisconsin Ave
- 707 N Sycamore St Unit 1
- 700 W Saginaw St Unit A
- 711 N Sycamore St
- 806 W Saginaw St
- 717 N Sycamore St
- 723 N Sycamore St
- 730 Wisconsin Ave
- 723 W Saginaw St
- 719 Wisconsin Ave
- 719 W Saginaw St
- 727 W Saginaw St
- 717 W Saginaw St
Your Personal Tour Guide
Ask me questions while you tour the home.