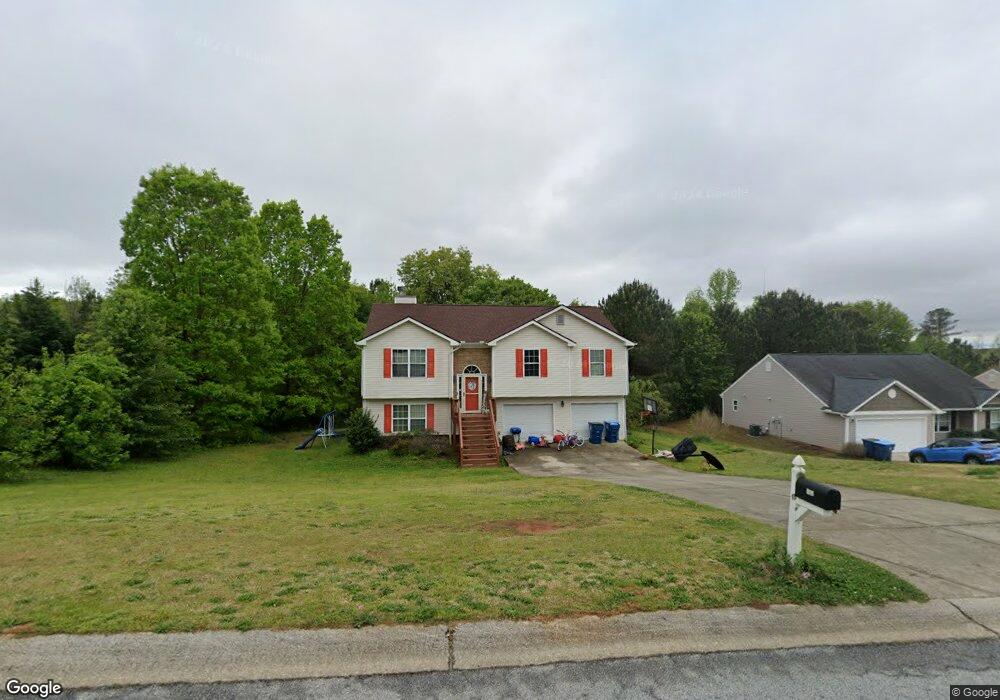
722 Worth Ct Bethlehem, GA 30620
Estimated Value: $341,000 - $373,000
4
Beds
3
Baths
2,074
Sq Ft
$169/Sq Ft
Est. Value
About This Home
This home is located at 722 Worth Ct, Bethlehem, GA 30620 and is currently estimated at $350,004, approximately $168 per square foot. 722 Worth Ct is a home located in Barrow County with nearby schools including Yargo Elementary School, Haymon-Morris Middle School, and Apalachee High School.
Ownership History
Date
Name
Owned For
Owner Type
Purchase Details
Closed on
Nov 16, 2009
Sold by
Deutsche Ffmlt 2006-Ff13
Bought by
Jones Belinda S
Current Estimated Value
Home Financials for this Owner
Home Financials are based on the most recent Mortgage that was taken out on this home.
Original Mortgage
$98,469
Outstanding Balance
$64,033
Interest Rate
4.92%
Mortgage Type
New Conventional
Estimated Equity
$285,971
Purchase Details
Closed on
May 5, 2009
Sold by
Bieber A Gordon
Bought by
Deutsche Bk Na Ffmlt 2006-Ff13
Purchase Details
Closed on
Jul 10, 2006
Sold by
Crown Park Hmsctd Llc
Bought by
Bieber A Gordon
Home Financials for this Owner
Home Financials are based on the most recent Mortgage that was taken out on this home.
Original Mortgage
$173,900
Interest Rate
6.6%
Mortgage Type
New Conventional
Purchase Details
Closed on
Jun 3, 2005
Sold by
Austin Ridge Development Inc
Bought by
Custom Dream Homes Llc
Purchase Details
Closed on
Apr 23, 2004
Bought by
Austin Ridge Development Inc
Create a Home Valuation Report for This Property
The Home Valuation Report is an in-depth analysis detailing your home's value as well as a comparison with similar homes in the area
Home Values in the Area
Average Home Value in this Area
Purchase History
| Date | Buyer | Sale Price | Title Company |
|---|---|---|---|
| Jones Belinda S | $96,500 | -- | |
| Deutsche Bk Na Ffmlt 2006-Ff13 | $131,750 | -- | |
| Bieber A Gordon | -- | -- | |
| Crown Park Hmsctd Llc | -- | -- | |
| Bieber A Gordon | $173,900 | -- | |
| Custom Dream Homes Llc | $40,000 | -- | |
| Austin Ridge Development Inc | -- | -- |
Source: Public Records
Mortgage History
| Date | Status | Borrower | Loan Amount |
|---|---|---|---|
| Open | Jones Belinda S | $98,469 | |
| Previous Owner | Bieber A Gordon | $173,900 |
Source: Public Records
Tax History Compared to Growth
Tax History
| Year | Tax Paid | Tax Assessment Tax Assessment Total Assessment is a certain percentage of the fair market value that is determined by local assessors to be the total taxable value of land and additions on the property. | Land | Improvement |
|---|---|---|---|---|
| 2024 | $2,566 | $103,485 | $21,200 | $82,285 |
| 2023 | $2,161 | $103,885 | $21,200 | $82,685 |
| 2022 | $2,324 | $81,418 | $21,200 | $60,218 |
| 2021 | $2,355 | $78,218 | $18,000 | $60,218 |
| 2020 | $2,355 | $78,218 | $18,000 | $60,218 |
| 2019 | $2,395 | $78,218 | $18,000 | $60,218 |
| 2018 | $2,180 | $72,017 | $14,400 | $57,617 |
| 2017 | $1,788 | $61,406 | $14,400 | $47,006 |
| 2016 | $1,585 | $53,640 | $14,400 | $39,240 |
| 2015 | $1,605 | $54,063 | $14,400 | $39,663 |
| 2014 | $1,379 | $46,085 | $8,036 | $38,049 |
| 2013 | -- | $43,648 | $8,036 | $35,612 |
Source: Public Records
Map
Nearby Homes
- 724 Westbury Dr
- 720 Westbury Ct
- 1900 Sandalwood Ct
- 713 Carl Bethlehem Rd
- 1164 Otis Dr
- 704 Newnham Walk
- 2018 Ben Johnson Rd
- 784 Morris Ln
- 159 Cole Cir
- 1630 Miller Valley Ln
- 933 Kendall Park Dr
- 1129 Loganville Hwy
- 209 Angie Way
- 834 Kendall Park Dr Unit 1
- 903 Kendall Park Dr
- 917 Lochwolde Ln
- 1411 Silvergate Way
- 724 Worth Ct
- 720 Worth Ct
- 718 Worth Ct
- 726 Worth Ct
- 726 Worth Ct
- 731 Worth Ct
- 0 Worth Ct Unit 7465936
- 0 Worth Ct Unit 7323896
- 0 Worth Ct Unit 8190158
- 0 Worth Ct Unit 7620531
- 0 Worth Ct Unit 7551595
- 0 Worth Ct Unit 3153456
- 0 Worth Ct Unit 7402669
- 0 Worth Ct Unit 7399595
- 0 Worth Ct Unit 7608507
- 0 Worth Ct Unit 7638141
- 0 Worth Ct Unit 7545475
- 0 Worth Ct Unit 7381116
- 0 Worth Ct Unit 7147993
- 0 Worth Ct Unit 8854715