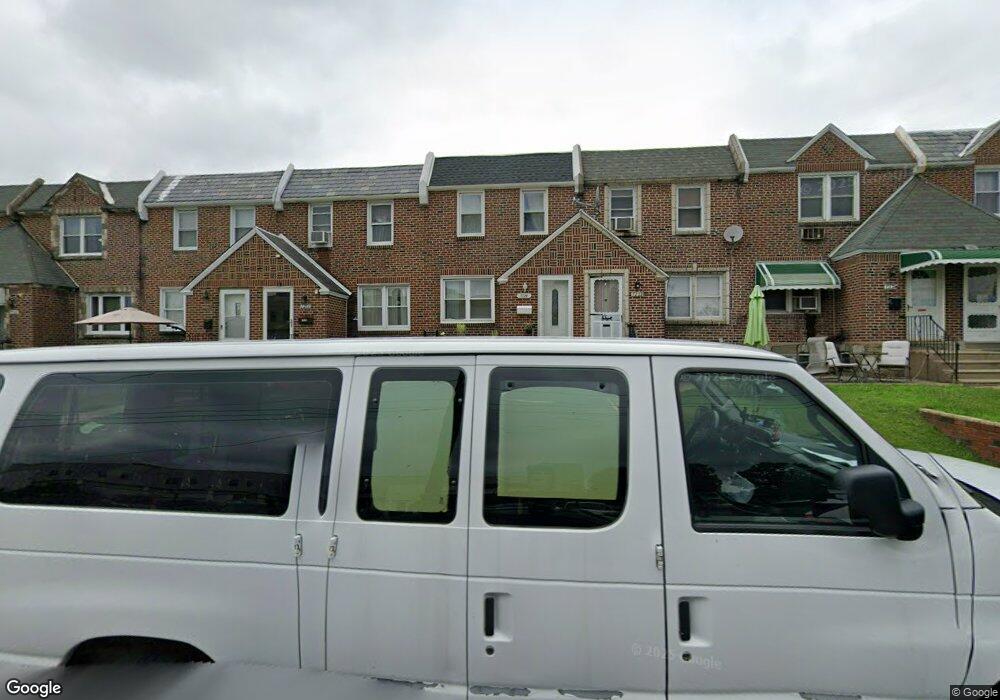
7220 Calvert St Philadelphia, PA 19149
Castor Gardens NeighborhoodEstimated Value: $237,222 - $267,000
3
Beds
1
Bath
1,152
Sq Ft
$216/Sq Ft
Est. Value
About This Home
This home is located at 7220 Calvert St, Philadelphia, PA 19149 and is currently estimated at $249,306, approximately $216 per square foot. 7220 Calvert St is a home located in Philadelphia County with nearby schools including Solomon Solis-Cohen School, Castor Gardens Middle School, and Northeast High School.
Ownership History
Date
Name
Owned For
Owner Type
Purchase Details
Closed on
Sep 22, 2021
Sold by
Raul Rivera
Bought by
Tam Sing Chek and Deng Shao Ting
Current Estimated Value
Home Financials for this Owner
Home Financials are based on the most recent Mortgage that was taken out on this home.
Original Mortgage
$138,000
Interest Rate
2.8%
Mortgage Type
New Conventional
Purchase Details
Closed on
Aug 27, 2007
Sold by
Johnson Lloyd
Bought by
Rivera Raul and Rivera Claribel
Home Financials for this Owner
Home Financials are based on the most recent Mortgage that was taken out on this home.
Original Mortgage
$93,750
Interest Rate
6.71%
Mortgage Type
Purchase Money Mortgage
Purchase Details
Closed on
Mar 18, 2002
Sold by
Keenan Glenn and Keenan Rachel
Bought by
Johnson Lloyd
Home Financials for this Owner
Home Financials are based on the most recent Mortgage that was taken out on this home.
Original Mortgage
$75,050
Interest Rate
6.84%
Purchase Details
Closed on
Nov 17, 1995
Sold by
Keenan Elva
Bought by
Keenan Glenn and Keenan Rachel
Create a Home Valuation Report for This Property
The Home Valuation Report is an in-depth analysis detailing your home's value as well as a comparison with similar homes in the area
Home Values in the Area
Average Home Value in this Area
Purchase History
| Date | Buyer | Sale Price | Title Company |
|---|---|---|---|
| Tam Sing Chek | $230,000 | Germantown Title | |
| Rivera Raul | $125,000 | None Available | |
| Johnson Lloyd | $80,000 | -- | |
| Keenan Glenn | -- | -- |
Source: Public Records
Mortgage History
| Date | Status | Borrower | Loan Amount |
|---|---|---|---|
| Previous Owner | Tam Sing Chek | $138,000 | |
| Previous Owner | Rivera Raul | $93,750 | |
| Previous Owner | Johnson Lloyd | $75,050 |
Source: Public Records
Tax History Compared to Growth
Tax History
| Year | Tax Paid | Tax Assessment Tax Assessment Total Assessment is a certain percentage of the fair market value that is determined by local assessors to be the total taxable value of land and additions on the property. | Land | Improvement |
|---|---|---|---|---|
| 2025 | $2,835 | $235,000 | $47,000 | $188,000 |
| 2024 | $2,835 | $235,000 | $47,000 | $188,000 |
| 2023 | $2,835 | $202,500 | $40,500 | $162,000 |
| 2022 | $704 | $157,500 | $40,500 | $117,000 |
| 2021 | $1,964 | $0 | $0 | $0 |
| 2020 | $1,964 | $0 | $0 | $0 |
| 2019 | $1,884 | $0 | $0 | $0 |
| 2018 | $1,751 | $0 | $0 | $0 |
| 2017 | $1,751 | $0 | $0 | $0 |
| 2016 | $1,734 | $0 | $0 | $0 |
| 2015 | -- | $0 | $0 | $0 |
| 2014 | -- | $125,100 | $22,107 | $102,993 |
| 2012 | -- | $15,968 | $1,365 | $14,603 |
Source: Public Records
Map
Nearby Homes
- 7204 Rupert St
- 7246 Calvert St
- 7249 Rupert St
- 2240 Friendship St
- 7223 Hanford St
- 2206 Princeton Ave
- 7214 Bradford St
- 2162 Princeton Ave
- 2105 Friendship St
- 2140 Princeton Ave
- 7017 Calvert St
- 7155 Saul St
- 7153 Saul St
- 7121 Brous Ave
- 2257 Disston St
- 2171 Disston St
- 7231 Eastwood St
- 7247 Eastwood St
- 2248 Disston St
- 7233 Barnard Ave
- 7218 Calvert St
- 7222 Calvert St
- 7216 Calvert St
- 7224 Calvert St
- 7214 Calvert St
- 7226 Calvert St
- 7212 Calvert St
- 7228 Calvert St
- 7210 Calvert St
- 7230 Calvert St
- 7219 Rupert St
- 7217 Rupert St
- 7223 Rupert St
- 7221 Rupert St
- 7208 Calvert St
- 7232 Calvert St
- 7215 Rupert St
- 7225 Rupert St
- 7227 Rupert St
- 7213 Rupert St