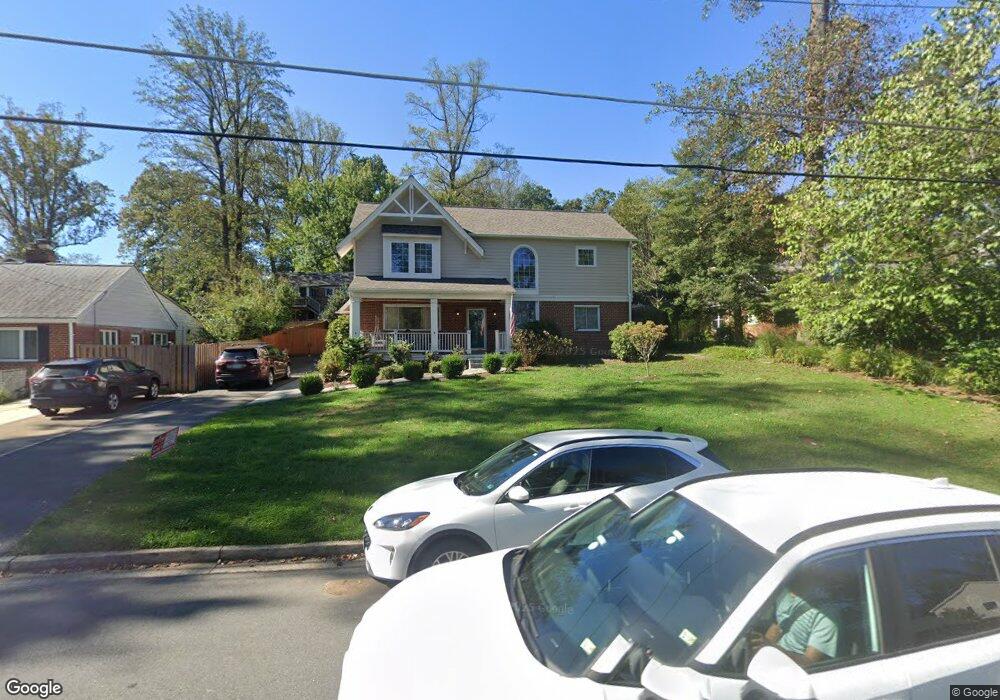
7223 Allan Ave Falls Church, VA 22046
Estimated Value: $1,150,360 - $1,375,000
5
Beds
3
Baths
2,748
Sq Ft
$456/Sq Ft
Est. Value
About This Home
This home is located at 7223 Allan Ave, Falls Church, VA 22046 and is currently estimated at $1,253,340, approximately $456 per square foot. 7223 Allan Ave is a home located in Fairfax County with nearby schools including Timber Lane Elementary School, Longfellow Middle School, and St. James Catholic School.
Ownership History
Date
Name
Owned For
Owner Type
Purchase Details
Closed on
Jun 28, 2011
Sold by
Beyer Christine
Bought by
Robell Jonathan and Robell Jennifer
Current Estimated Value
Home Financials for this Owner
Home Financials are based on the most recent Mortgage that was taken out on this home.
Original Mortgage
$626,737
Outstanding Balance
$433,408
Interest Rate
4.62%
Mortgage Type
VA
Estimated Equity
$819,932
Purchase Details
Closed on
Sep 21, 2005
Sold by
Markham Rodney Eugene
Bought by
Beyer Christine
Home Financials for this Owner
Home Financials are based on the most recent Mortgage that was taken out on this home.
Original Mortgage
$650,000
Interest Rate
5.92%
Mortgage Type
New Conventional
Purchase Details
Closed on
Nov 30, 1993
Sold by
Hough J E
Bought by
Markham Deborah J
Home Financials for this Owner
Home Financials are based on the most recent Mortgage that was taken out on this home.
Original Mortgage
$168,600
Interest Rate
6.72%
Create a Home Valuation Report for This Property
The Home Valuation Report is an in-depth analysis detailing your home's value as well as a comparison with similar homes in the area
Home Values in the Area
Average Home Value in this Area
Purchase History
| Date | Buyer | Sale Price | Title Company |
|---|---|---|---|
| Robell Jonathan | $745,000 | -- | |
| Beyer Christine | $845,000 | -- | |
| Markham Deborah J | $177,500 | -- |
Source: Public Records
Mortgage History
| Date | Status | Borrower | Loan Amount |
|---|---|---|---|
| Open | Robell Jonathan | $626,737 | |
| Previous Owner | Beyer Christine | $650,000 | |
| Previous Owner | Markham Deborah J | $168,600 |
Source: Public Records
Tax History Compared to Growth
Tax History
| Year | Tax Paid | Tax Assessment Tax Assessment Total Assessment is a certain percentage of the fair market value that is determined by local assessors to be the total taxable value of land and additions on the property. | Land | Improvement |
|---|---|---|---|---|
| 2025 | $11,512 | $935,430 | $351,000 | $584,430 |
| 2024 | $11,512 | $930,520 | $351,000 | $579,520 |
| 2023 | $10,755 | $900,000 | $341,000 | $559,000 |
| 2022 | $10,482 | $866,030 | $321,000 | $545,030 |
| 2021 | $9,737 | $787,610 | $321,000 | $466,610 |
| 2020 | $9,312 | $747,990 | $286,000 | $461,990 |
| 2019 | $8,870 | $709,770 | $282,000 | $427,770 |
| 2018 | $8,036 | $698,770 | $271,000 | $427,770 |
| 2017 | $8,251 | $673,400 | $266,000 | $407,400 |
| 2016 | $8,499 | $694,840 | $266,000 | $428,840 |
| 2015 | $8,147 | $689,840 | $261,000 | $428,840 |
| 2014 | $8,130 | $689,840 | $261,000 | $428,840 |
Source: Public Records
Map
Nearby Homes
- 7228 Allan Ave
- 1015 Kennedy St
- 608 Laura Dr
- 2647 Woodley Place
- 7203 Arthur Dr
- 601 Timber Ln
- 7354 Route 29 Unit 54/104
- 7354 Route 29 Unit 54/T2
- 7370 Lee Hwy Unit 204
- 2417 Falls Place Ct
- 7334 Pinecastle Rd
- 7314 Route 29 Unit 14/103
- 7322 Route 29 Unit 22/103
- 2335 Dale Dr
- 2821 Kalmia Lee Ct Unit B-302
- 2339 Barbour Rd
- 7566 Wood Mist Ln
- 1134 S Washington St Unit T1
- 134 Birch St Unit A4
- 7616 Wood Mist Ln
- 7221 Allan Ave
- 7225 Allan Ave
- 7232 Woodley Place
- 7234 Woodley Place
- 7227 Allan Ave
- 2616 West St
- 7236 Woodley Place
- 7226 Allan Ave
- 7222 Allan Ave
- 7229 Allan Ave
- 7220 Allan Ave
- 7231 Woodley Place
- 7238 Woodley Place
- 7230 Allan Ave
- 2620 West St
- 2615 West St
- 7231 Allan Ave
- 2617 West St
- 613 Abbott Ln
- 7213 Tod St