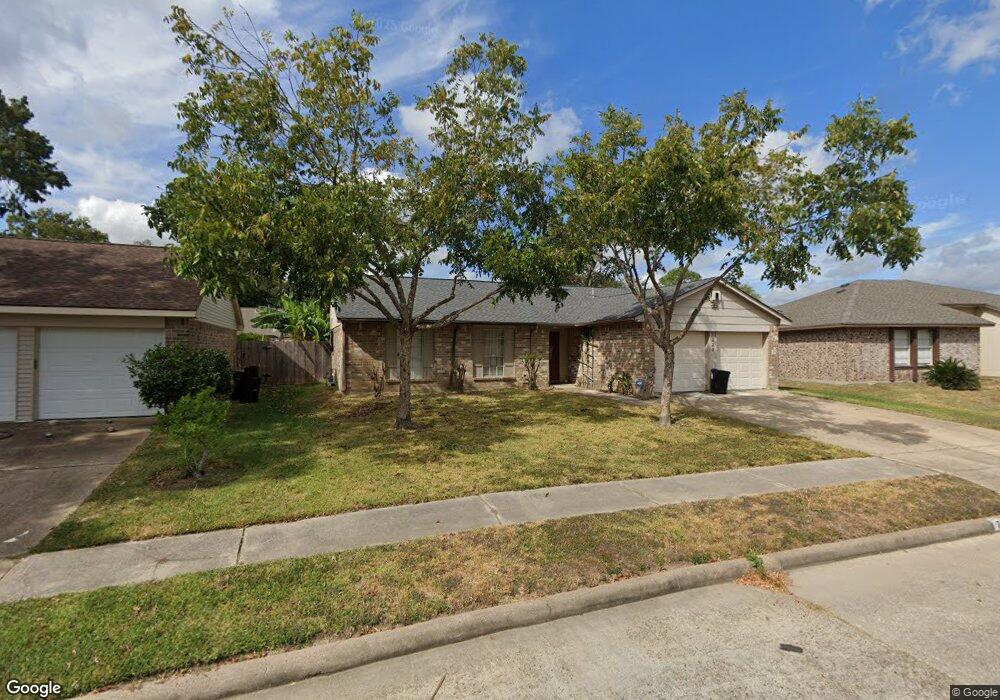
7223 Gallant Glen Ln Houston, TX 77095
Copperfield NeighborhoodEstimated Value: $231,000 - $254,000
4
Beds
2
Baths
1,545
Sq Ft
$157/Sq Ft
Est. Value
About This Home
This home is located at 7223 Gallant Glen Ln, Houston, TX 77095 and is currently estimated at $241,865, approximately $156 per square foot. 7223 Gallant Glen Ln is a home located in Harris County with nearby schools including Holmsley Elementary School, Aragon Middle School, and Langham Creek High School.
Ownership History
Date
Name
Owned For
Owner Type
Purchase Details
Closed on
Dec 16, 2003
Sold by
Equicap Real Estate Fund Ii Lp
Bought by
Flores Jose M and Flores Diocelina
Current Estimated Value
Home Financials for this Owner
Home Financials are based on the most recent Mortgage that was taken out on this home.
Original Mortgage
$94,000
Outstanding Balance
$43,831
Interest Rate
5.97%
Mortgage Type
Purchase Money Mortgage
Estimated Equity
$198,034
Purchase Details
Closed on
Mar 4, 2003
Sold by
Roberts Scott T
Bought by
Equicap Real Estate Fund Ii Lp
Purchase Details
Closed on
May 30, 2000
Sold by
Doyle Ira and Doyle Leslie
Bought by
Roberts Scott T
Home Financials for this Owner
Home Financials are based on the most recent Mortgage that was taken out on this home.
Original Mortgage
$57,450
Interest Rate
8.17%
Create a Home Valuation Report for This Property
The Home Valuation Report is an in-depth analysis detailing your home's value as well as a comparison with similar homes in the area
Home Values in the Area
Average Home Value in this Area
Purchase History
| Date | Buyer | Sale Price | Title Company |
|---|---|---|---|
| Flores Jose M | -- | Stewart Title Houston Div | |
| Equicap Real Estate Fund Ii Lp | $64,900 | -- | |
| Roberts Scott T | -- | Stewart Title |
Source: Public Records
Mortgage History
| Date | Status | Borrower | Loan Amount |
|---|---|---|---|
| Open | Flores Jose M | $94,000 | |
| Previous Owner | Roberts Scott T | $57,450 |
Source: Public Records
Tax History Compared to Growth
Tax History
| Year | Tax Paid | Tax Assessment Tax Assessment Total Assessment is a certain percentage of the fair market value that is determined by local assessors to be the total taxable value of land and additions on the property. | Land | Improvement |
|---|---|---|---|---|
| 2025 | $3,352 | $228,462 | $49,420 | $179,042 |
| 2024 | $3,352 | $228,462 | $49,420 | $179,042 |
| 2023 | $3,352 | $229,331 | $49,420 | $179,911 |
| 2022 | $4,571 | $210,136 | $41,130 | $169,006 |
| 2021 | $4,327 | $174,852 | $41,130 | $133,722 |
| 2020 | $4,098 | $151,526 | $31,565 | $119,961 |
| 2019 | $3,764 | $145,275 | $23,594 | $121,681 |
| 2018 | $1,182 | $133,822 | $23,594 | $110,228 |
| 2017 | $3,218 | $129,825 | $23,594 | $106,231 |
| 2016 | $2,925 | $123,779 | $23,594 | $100,185 |
| 2015 | $1,862 | $112,427 | $15,623 | $96,804 |
| 2014 | $1,862 | $96,278 | $15,623 | $80,655 |
Source: Public Records
Map
Nearby Homes
- 7254 Sonnet Glen Ln
- 17015 Sky Blue Place
- 7311 Barton Oaks Dr
- 7306 Bubbling Brooks Ln
- 16734 Pebbleglen Dr
- 17234 Rush Trace Ct
- 16902 Terrace Park Dr
- 17206 Haley Falls Ln
- 17230 Valhallah Way
- 7307 Sunlight Ln
- 16714 Rockbend
- 7215 Daylight Ln
- 6839 Catarina Cir
- 16911 Shady Square Ct
- 17250 Cricketbriar Ct
- 16706 Blairstone
- 17325 Fm 529 Rd
- 17222 Crown Meadow Ct
- 16606 Cliff Vale Ct
- 7607 Plumtree Forest Cir
- 7219 Gallant Glen Ln
- 7227 Gallant Glen Ln
- 7230 Sonnet Glen Ln
- 7226 Sonnet Glen Ln
- 7238 Sonnet Glen Ln
- 7215 Gallant Glen Ln
- 7231 Gallant Glen Ln
- 7222 Sonnet Glen Ln
- 7242 Sonnet Glen Ln
- 7222 Gallant Glen Ln
- 7230 Gallant Glen Ln
- 7218 Gallant Glen Ln
- 7211 Gallant Glen Ln
- 7235 Gallant Glen Ln
- 7246 Sonnet Glen Ln
- 7214 Gallant Glen Ln
- 7218 Sonnet Glen Ln
- 7234 Gallant Glen Ln
- 7250 Sonnet Glen Ln
- 16754 Dew Drop Ln