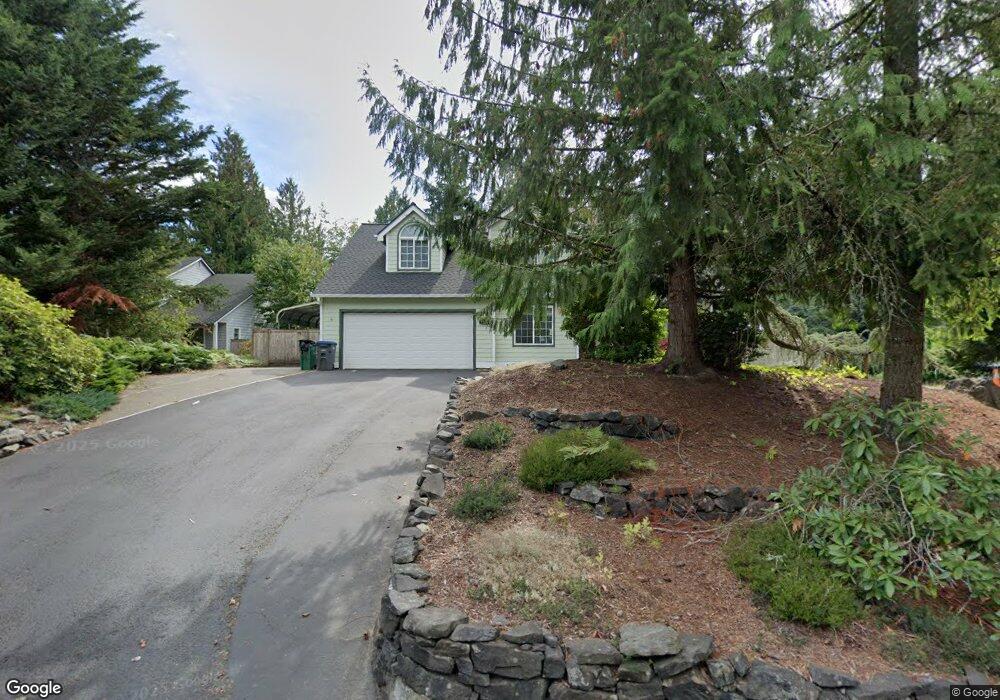
7224 Fern Vista Place SW Port Orchard, WA 98367
Estimated Value: $641,000 - $805,000
3
Beds
3
Baths
2,239
Sq Ft
$312/Sq Ft
Est. Value
About This Home
This home is located at 7224 Fern Vista Place SW, Port Orchard, WA 98367 and is currently estimated at $697,843, approximately $311 per square foot. 7224 Fern Vista Place SW is a home located in Kitsap County with nearby schools including Sidney Glen Elementary School, Cedar Heights Middle School, and South Kitsap High School.
Ownership History
Date
Name
Owned For
Owner Type
Purchase Details
Closed on
Jun 12, 2017
Sold by
Sansen Jennifer H
Bought by
Tilly John and Sansen Jennifer H
Current Estimated Value
Purchase Details
Closed on
Sep 3, 2010
Sold by
Tilly John D
Bought by
Sansen Jennifer H
Home Financials for this Owner
Home Financials are based on the most recent Mortgage that was taken out on this home.
Original Mortgage
$295,518
Interest Rate
4.48%
Mortgage Type
New Conventional
Purchase Details
Closed on
Mar 27, 1998
Sold by
Chateau Development Inc
Bought by
Weir David and Sanson Weir Jennifer H
Home Financials for this Owner
Home Financials are based on the most recent Mortgage that was taken out on this home.
Original Mortgage
$166,950
Interest Rate
7%
Create a Home Valuation Report for This Property
The Home Valuation Report is an in-depth analysis detailing your home's value as well as a comparison with similar homes in the area
Home Values in the Area
Average Home Value in this Area
Purchase History
| Date | Buyer | Sale Price | Title Company |
|---|---|---|---|
| Tilly John | $281 | None Available | |
| Sansen Jennifer H | -- | Pacific Nw Title | |
| Weir David | $185,500 | Pacific Northwest Title |
Source: Public Records
Mortgage History
| Date | Status | Borrower | Loan Amount |
|---|---|---|---|
| Previous Owner | Sansen Jennifer H | $295,518 | |
| Previous Owner | Weir David | $166,950 |
Source: Public Records
Tax History Compared to Growth
Tax History
| Year | Tax Paid | Tax Assessment Tax Assessment Total Assessment is a certain percentage of the fair market value that is determined by local assessors to be the total taxable value of land and additions on the property. | Land | Improvement |
|---|---|---|---|---|
| 2026 | $5,304 | $608,680 | $80,300 | $528,380 |
| 2025 | $5,304 | $608,680 | $80,300 | $528,380 |
| 2024 | $5,143 | $608,680 | $80,300 | $528,380 |
| 2023 | $5,110 | $608,680 | $80,300 | $528,380 |
| 2022 | $4,940 | $492,900 | $64,010 | $428,890 |
| 2021 | $4,725 | $445,830 | $58,190 | $387,640 |
| 2020 | $4,558 | $417,580 | $57,100 | $360,480 |
| 2019 | $3,875 | $389,450 | $52,780 | $336,670 |
| 2018 | $4,139 | $317,980 | $45,420 | $272,560 |
| 2017 | $3,489 | $317,980 | $45,420 | $272,560 |
| 2016 | $3,435 | $286,480 | $43,260 | $243,220 |
| 2015 | $3,326 | $280,940 | $43,260 | $237,680 |
| 2014 | -- | $248,010 | $43,490 | $204,520 |
| 2013 | -- | $241,550 | $43,490 | $198,060 |
Source: Public Records
Map
Nearby Homes
- 7261 Fern Vista Place SW
- 0 SW Glenwood Rd Unit NWM2457669
- 700 SW Black Jack Ln
- 30 Acres Glenwood Rd SW
- 1123 SW Sedge St
- Sherwood Plan at Stetson Heights
- Cambridge Plan at Stetson Heights
- Bristol Plan at Stetson Heights
- Berkshire Plan at Stetson Heights
- Hawthorne Plan at Stetson Heights
- Ballard Plan at Stetson Heights
- Bradford Plan at Stetson Heights
- 5965 Waverly Rd SW
- 15081 Glenwood Rd SW
- 8840 Conwhit Ln SW
- 7139 SW Dunraven Ln
- 8718 Sidney Rd SW
- 1081 SW Pendleton Way
- 5230 Sidney Rd SW
- 959 SE Spencer Ave
- 7230 Fern Vista Place SW
- 7218 Fern Vista Place SW
- 7236 Fern Vista Place SW
- 7212 Fern Vista Place SW
- 1265 SW Crossway Ct
- 1253 SW Crossway Ct
- 7225 Fern Vista Place SW
- 1259 SW Crossway Ct
- 7219 Fern Vista Place SW
- 7231 Fern Vista Place SW
- 1247 SW Crossway Ct
- 7206 Fern Vista Place SW
- 7254 Fern Vista Place SW
- 1271 SW Crossway Ct
- 7237 Fern Vista Place SW
- 7243 Fern Vista Place SW
- 1241 SW Crossway Ct
- 7249 Fern Vista Place SW
- 1266 SW Crossway Ct
- 1254 SW Crossway Ct