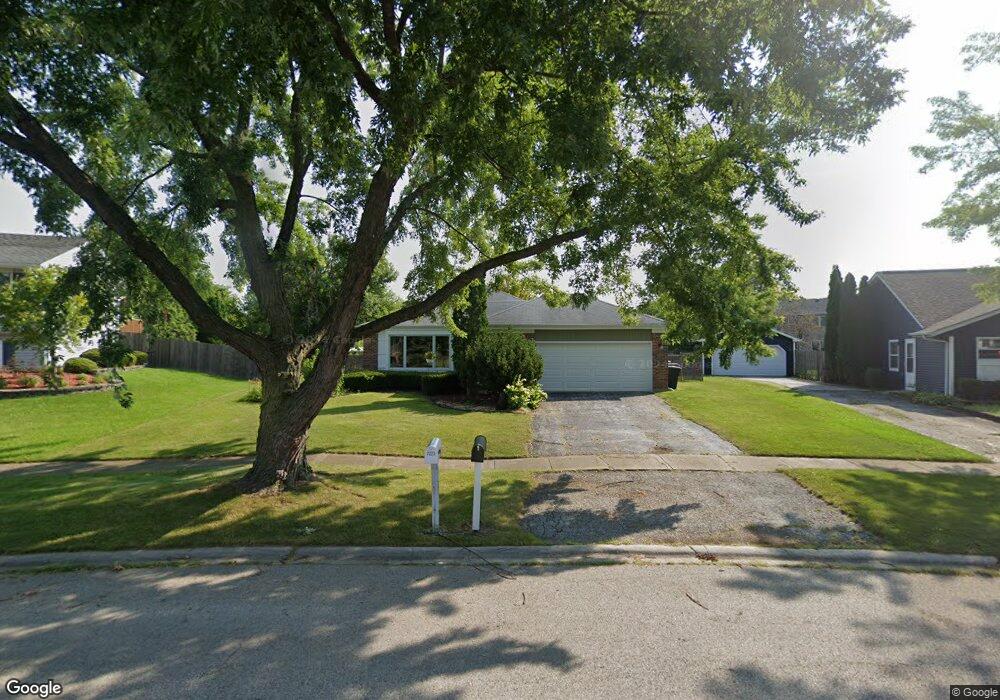
7224 W Mathews Dr Frankfort, IL 60423
Frankfort Square NeighborhoodEstimated Value: $336,000 - $381,000
3
Beds
2
Baths
1,212
Sq Ft
$299/Sq Ft
Est. Value
About This Home
This home is located at 7224 W Mathews Dr, Frankfort, IL 60423 and is currently estimated at $361,923, approximately $298 per square foot. 7224 W Mathews Dr is a home located in Will County with nearby schools including Indian Trail Elementary School, Summit Hill Junior High School, and Lincoln-Way East High School.
Ownership History
Date
Name
Owned For
Owner Type
Purchase Details
Closed on
Apr 15, 2009
Sold by
Webb Kathy and Webb Jeffrey
Bought by
Dominik Dan and Hentschel Holly C
Current Estimated Value
Home Financials for this Owner
Home Financials are based on the most recent Mortgage that was taken out on this home.
Original Mortgage
$192,950
Outstanding Balance
$123,604
Interest Rate
5.19%
Mortgage Type
Purchase Money Mortgage
Estimated Equity
$238,319
Purchase Details
Closed on
Jun 6, 2003
Sold by
Mecher Jack and Mecher Jennifer
Bought by
Oconnell Kathy
Home Financials for this Owner
Home Financials are based on the most recent Mortgage that was taken out on this home.
Original Mortgage
$195,387
Interest Rate
5.36%
Mortgage Type
FHA
Purchase Details
Closed on
Mar 30, 2001
Sold by
Franc Allen and Franc Jennifer
Bought by
Mecher Jack and Mecher Jennifer
Home Financials for this Owner
Home Financials are based on the most recent Mortgage that was taken out on this home.
Original Mortgage
$162,943
Interest Rate
7.13%
Mortgage Type
FHA
Create a Home Valuation Report for This Property
The Home Valuation Report is an in-depth analysis detailing your home's value as well as a comparison with similar homes in the area
Home Values in the Area
Average Home Value in this Area
Purchase History
| Date | Buyer | Sale Price | Title Company |
|---|---|---|---|
| Dominik Dan | $227,000 | Chicago Title Insurance Co | |
| Oconnell Kathy | $198,500 | Multiple | |
| Mecher Jack | $165,500 | Chicago Title Insurance Co |
Source: Public Records
Mortgage History
| Date | Status | Borrower | Loan Amount |
|---|---|---|---|
| Open | Dominik Dan | $192,950 | |
| Previous Owner | Oconnell Kathy | $195,387 | |
| Previous Owner | Mecher Jack | $162,943 |
Source: Public Records
Tax History Compared to Growth
Tax History
| Year | Tax Paid | Tax Assessment Tax Assessment Total Assessment is a certain percentage of the fair market value that is determined by local assessors to be the total taxable value of land and additions on the property. | Land | Improvement |
|---|---|---|---|---|
| 2024 | $7,656 | $98,773 | $21,018 | $77,755 |
| 2023 | $7,656 | $88,214 | $18,771 | $69,443 |
| 2022 | $6,788 | $80,348 | $17,097 | $63,251 |
| 2021 | $6,354 | $75,169 | $15,995 | $59,174 |
| 2020 | $6,252 | $73,050 | $15,544 | $57,506 |
| 2019 | $6,039 | $71,095 | $15,128 | $55,967 |
| 2018 | $5,813 | $69,051 | $14,693 | $54,358 |
| 2017 | $5,687 | $67,439 | $14,350 | $53,089 |
| 2016 | $5,505 | $65,127 | $13,858 | $51,269 |
| 2015 | $5,301 | $62,834 | $13,370 | $49,464 |
| 2014 | $5,301 | $62,397 | $13,277 | $49,120 |
| 2013 | $5,301 | $63,206 | $13,449 | $49,757 |
Source: Public Records
Map
Nearby Homes
- 7223 W Mathews Dr
- 7257 W Hickory Creek Dr
- 20729 S Hickory Creek Ct
- 7626 W Hickory Creek Dr
- 20347 S Grand Prairie Ln
- 20552 S Frankfort Square Rd
- 20513 S Acorn Ridge Dr
- 7639 W Juniper Ct
- 20349 S Green Meadow Ln
- 21375 Georgetown Rd
- 20206 S Frankfort Square Rd Unit A
- 21257 S 79th Ave
- 7752 W Almond Ct Unit 135
- 20130 S Frankfort Square Rd
- 20137 S Hampton Ct Unit A
- 6608 Pasture Side Trail
- 6520 Bridle Path Dr
- 6423 Gray Hawk Dr Unit 2716
- 237 Blackthorn Rd
- 6500 Pasture Side Trail
- 7228 W Mathews Dr
- 7231 W Hickory Creek Dr
- 7237 W Hickory Creek Dr
- 20802 S Hickory Creek Place
- 20808 S Hickory Creek Place
- 7234 W Mathews Dr
- 7212 W Mathews Dr
- 20760 S Hickory Creek Place
- 20814 S Hickory Creek Place
- 7243 W Hickory Creek Dr
- 20754 S Hickory Creek Place
- 20822 S Hickory Creek Place
- 7240 W Mathews Dr
- 7206 W Mathews Dr
- 7251 W Hickory Creek Dr Unit D
- 7215 W Mathews Dr
- 20828 S Hickory Creek Place
- 7253 W Hickory Creek Dr Unit 2
- 7246 W Mathews Dr
- 7209 W Mathews Dr