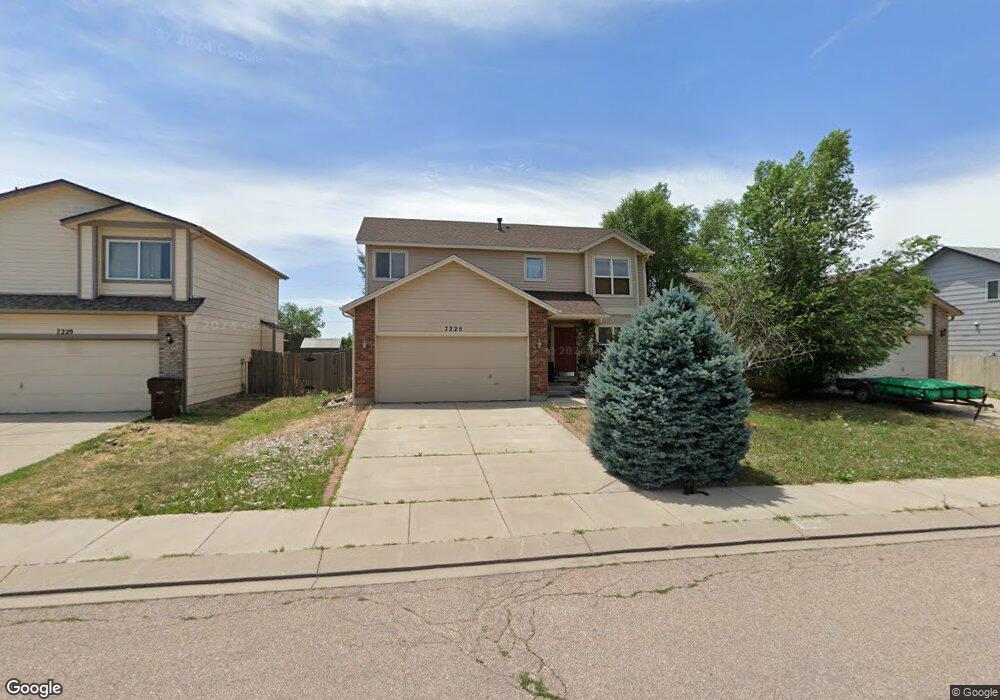
7225 Moss Bluff Ct Fountain, CO 80817
North Fountain Valley NeighborhoodEstimated Value: $414,365 - $445,000
4
Beds
4
Baths
1,480
Sq Ft
$289/Sq Ft
Est. Value
About This Home
This home is located at 7225 Moss Bluff Ct, Fountain, CO 80817 and is currently estimated at $428,341, approximately $289 per square foot. 7225 Moss Bluff Ct is a home located in El Paso County with nearby schools including Eagleside Elementary School, Fountain Middle School, and Fountain-Fort Carson High School.
Ownership History
Date
Name
Owned For
Owner Type
Purchase Details
Closed on
Nov 22, 2017
Sold by
Brown Christopher B and Brown Kristie L
Bought by
Bizarro Michael
Current Estimated Value
Home Financials for this Owner
Home Financials are based on the most recent Mortgage that was taken out on this home.
Original Mortgage
$275,805
Outstanding Balance
$231,477
Interest Rate
3.91%
Mortgage Type
VA
Estimated Equity
$196,864
Purchase Details
Closed on
Jan 29, 2007
Sold by
Rempfer Daniel T and Rempfer Jannette
Bought by
Brown Christopher B and Brown Kristie L
Home Financials for this Owner
Home Financials are based on the most recent Mortgage that was taken out on this home.
Original Mortgage
$240,052
Interest Rate
6.19%
Mortgage Type
VA
Purchase Details
Closed on
Jul 6, 2004
Sold by
The Rocky Mountain Home Co Llc
Bought by
Rempfer Daniel T and Rempfer Jannette
Home Financials for this Owner
Home Financials are based on the most recent Mortgage that was taken out on this home.
Original Mortgage
$194,486
Interest Rate
6.31%
Mortgage Type
VA
Create a Home Valuation Report for This Property
The Home Valuation Report is an in-depth analysis detailing your home's value as well as a comparison with similar homes in the area
Home Values in the Area
Average Home Value in this Area
Purchase History
| Date | Buyer | Sale Price | Title Company |
|---|---|---|---|
| Bizarro Michael | $270,000 | Heritage Title Co | |
| Brown Christopher B | $235,000 | Empire Title Co Springs Llc | |
| Rempfer Daniel T | $190,300 | Stewart Title |
Source: Public Records
Mortgage History
| Date | Status | Borrower | Loan Amount |
|---|---|---|---|
| Open | Bizarro Michael | $275,805 | |
| Previous Owner | Brown Christopher B | $240,052 | |
| Previous Owner | Rempfer Daniel T | $194,486 |
Source: Public Records
Tax History Compared to Growth
Tax History
| Year | Tax Paid | Tax Assessment Tax Assessment Total Assessment is a certain percentage of the fair market value that is determined by local assessors to be the total taxable value of land and additions on the property. | Land | Improvement |
|---|---|---|---|---|
| 2025 | $1,533 | $28,160 | -- | -- |
| 2024 | $1,373 | $29,080 | $4,340 | $24,740 |
| 2022 | $1,209 | $20,720 | $3,430 | $17,290 |
| 2021 | $1,123 | $21,320 | $3,530 | $17,790 |
| 2020 | $1,046 | $19,430 | $3,090 | $16,340 |
| 2019 | $1,026 | $19,430 | $3,090 | $16,340 |
| 2018 | $830 | $15,190 | $3,110 | $12,080 |
| 2017 | $820 | $15,190 | $3,110 | $12,080 |
| 2016 | $825 | $15,260 | $3,220 | $12,040 |
| 2015 | $826 | $15,260 | $3,220 | $12,040 |
| 2014 | $740 | $13,750 | $3,220 | $10,530 |
Source: Public Records
Map
Nearby Homes
- 7166 Araia Dr
- 1355 Fountain Mesa Rd
- 570 Calle Entrada
- 7069 Reunion Cir
- 803 Ridgebury Place
- 1034 Fountain Mesa Rd
- 510 Avenida Del Cielo
- 7326 Legacy Point
- 7327 Willow Pines Place
- 440 Calle Entrada
- 7081 Ancestra Dr
- 7110 Lake Ave
- 9491 Mosaic Heights
- 100 Fence Post Ct
- 6969 Ancestra Dr
- 1509 Monterey Way
- 7370 Tributary Ct
- 654 High Tea Ct
- 806 Desert Cir
- 845 Desert Cir
- 7229 Moss Bluff Ct
- 7221 Moss Bluff Ct
- 7233 Moss Bluff Ct
- 7217 Moss Bluff Ct
- 7237 Moss Bluff Ct
- 7213 Moss Bluff Ct
- 7226 Moss Bluff Ct
- 7230 Moss Bluff Ct
- 7222 Moss Bluff Ct
- 7234 Moss Bluff Ct
- 7209 Moss Bluff Ct
- 7241 Moss Bluff Ct
- 7218 Moss Bluff Ct
- 7238 Moss Bluff Ct
- 7214 Moss Bluff Ct
- 7205 Moss Bluff Ct
- 7245 Moss Bluff Ct
- 7242 Moss Bluff Ct
- 7210 Moss Bluff Ct
- 7246 Moss Bluff Ct