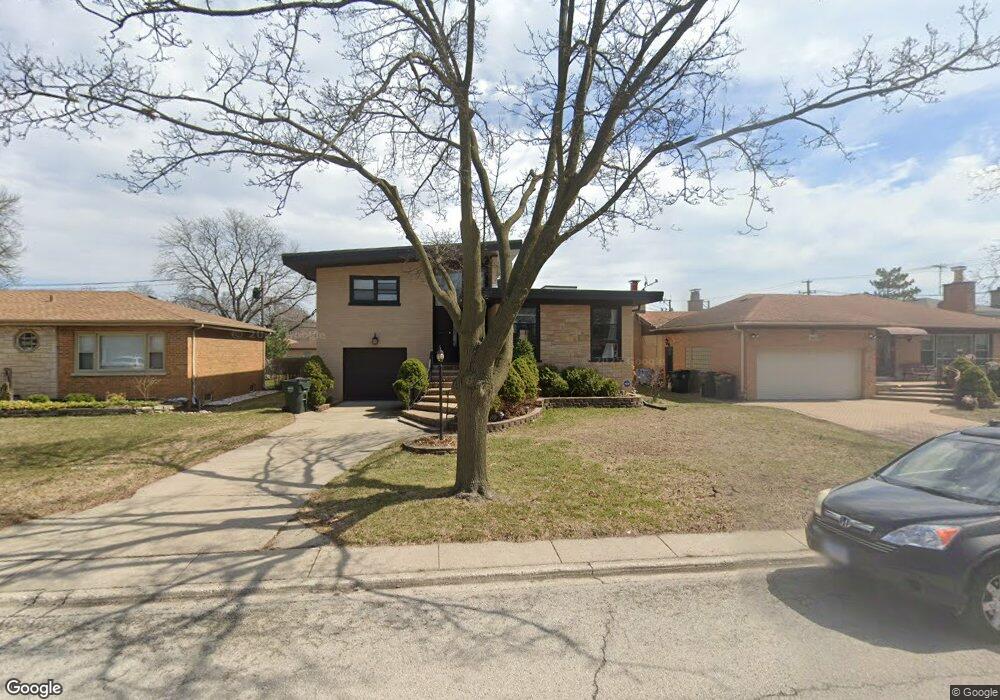
7227 N Karlov Ave Lincolnwood, IL 60712
Estimated Value: $636,443 - $721,000
3
Beds
3
Baths
3,500
Sq Ft
$192/Sq Ft
Est. Value
About This Home
This home is located at 7227 N Karlov Ave, Lincolnwood, IL 60712 and is currently estimated at $673,111, approximately $192 per square foot. 7227 N Karlov Ave is a home located in Cook County with nearby schools including Todd Hall Elementary School, Rutledge Hall Elementary School, and Lincoln Hall Middle School.
Ownership History
Date
Name
Owned For
Owner Type
Purchase Details
Closed on
Jan 19, 2022
Sold by
Lambrinatos Nicholas
Bought by
Joseph Gail
Current Estimated Value
Purchase Details
Closed on
Nov 3, 2021
Sold by
Gail Joseph
Bought by
Gail Joseph and Gail Joseph Living Trust
Purchase Details
Closed on
May 17, 2013
Sold by
Andra Avram
Bought by
Lambrinatos Nicholas
Home Financials for this Owner
Home Financials are based on the most recent Mortgage that was taken out on this home.
Original Mortgage
$332,000
Interest Rate
3.43%
Mortgage Type
New Conventional
Purchase Details
Closed on
Jul 9, 2004
Sold by
Bernal Rodolfo
Bought by
Andra Avram
Home Financials for this Owner
Home Financials are based on the most recent Mortgage that was taken out on this home.
Original Mortgage
$382,500
Interest Rate
6.75%
Mortgage Type
Unknown
Purchase Details
Closed on
Nov 21, 2002
Sold by
Bernal Rodolfo D
Bought by
Bernal Rodolfo D and Laguatan Josephine Bernal
Create a Home Valuation Report for This Property
The Home Valuation Report is an in-depth analysis detailing your home's value as well as a comparison with similar homes in the area
Home Values in the Area
Average Home Value in this Area
Purchase History
| Date | Buyer | Sale Price | Title Company |
|---|---|---|---|
| Joseph Gail | -- | -- | |
| Joseph Gail | -- | -- | |
| Gail Joseph | -- | Attorney | |
| Lambrinatos Nicholas | $415,000 | None Available | |
| Andra Avram | $450,000 | Chicago Title Insurance Comp | |
| Bernal Rodolfo D | -- | Chicago Title Insurance Comp | |
| Bernal Rodolfo D | -- | -- |
Source: Public Records
Mortgage History
| Date | Status | Borrower | Loan Amount |
|---|---|---|---|
| Previous Owner | Lambrinatos Nicholas | $332,000 | |
| Previous Owner | Andra Avram | $382,500 |
Source: Public Records
Tax History Compared to Growth
Tax History
| Year | Tax Paid | Tax Assessment Tax Assessment Total Assessment is a certain percentage of the fair market value that is determined by local assessors to be the total taxable value of land and additions on the property. | Land | Improvement |
|---|---|---|---|---|
| 2024 | $5,594 | $22,577 | $5,166 | $17,411 |
| 2023 | $5,360 | $22,577 | $5,166 | $17,411 |
| 2022 | $5,360 | $22,577 | $5,166 | $17,411 |
| 2021 | $4,807 | $16,569 | $3,690 | $12,879 |
| 2020 | $4,719 | $16,569 | $3,690 | $12,879 |
| 2019 | $4,319 | $18,411 | $3,690 | $14,721 |
| 2018 | $5,257 | $21,091 | $3,228 | $17,863 |
| 2017 | $5,287 | $21,091 | $3,228 | $17,863 |
| 2016 | $5,140 | $21,091 | $3,228 | $17,863 |
| 2015 | $4,893 | $18,796 | $2,767 | $16,029 |
| 2014 | $4,702 | $18,796 | $2,767 | $16,029 |
| 2013 | $4,589 | $18,796 | $2,767 | $16,029 |
Source: Public Records
Map
Nearby Homes
- 7230 N Keeler Ave
- 4021 W Estes Ave
- 7225 N East Prairie Rd
- 7424 Crawford Ave
- 3846 W Touhy Ave
- 7412 Keeler Ave
- 7226 N Kildare Ave
- 3924 W Greenleaf Ave
- 3832 W Chase Ave
- 7427 Tripp Ave
- 3836 W Estes Ave
- 3814 W Sherwin Ave
- 6936 N Keystone Ave
- 7245 N Kostner Ave
- 3819 W Greenleaf Ave
- 7201 N Lincoln Ave Unit 308
- 7201 N Lincoln Ave Unit 301
- 7330 N Kilbourn Ave
- 4545 W Touhy Ave Unit 511
- 4545 W Touhy Ave Unit 420
- 7227 N Karlov Ave
- 7233 N Karlov Ave
- 7233 N Karlov Ave
- 7219 N Karlov Ave
- 7219 N Karlov Ave
- 7239 N Karlov Ave
- 7239 N Karlov Ave
- 7215 N Karlov Ave
- 7230 N Keystone Ave
- 7230 N Keystone Ave
- 7220 N Keystone Ave
- 7220 N Keystone Ave
- 7232 N Keystone Ave
- 7232 N Keystone Ave
- 7214 N Keystone Ave
- 7214 N Keystone Ave
- 7245 N Karlov Ave
- 7245 N Karlov Ave
- 7230 N Karlov Ave
- 7230 N Karlov Ave