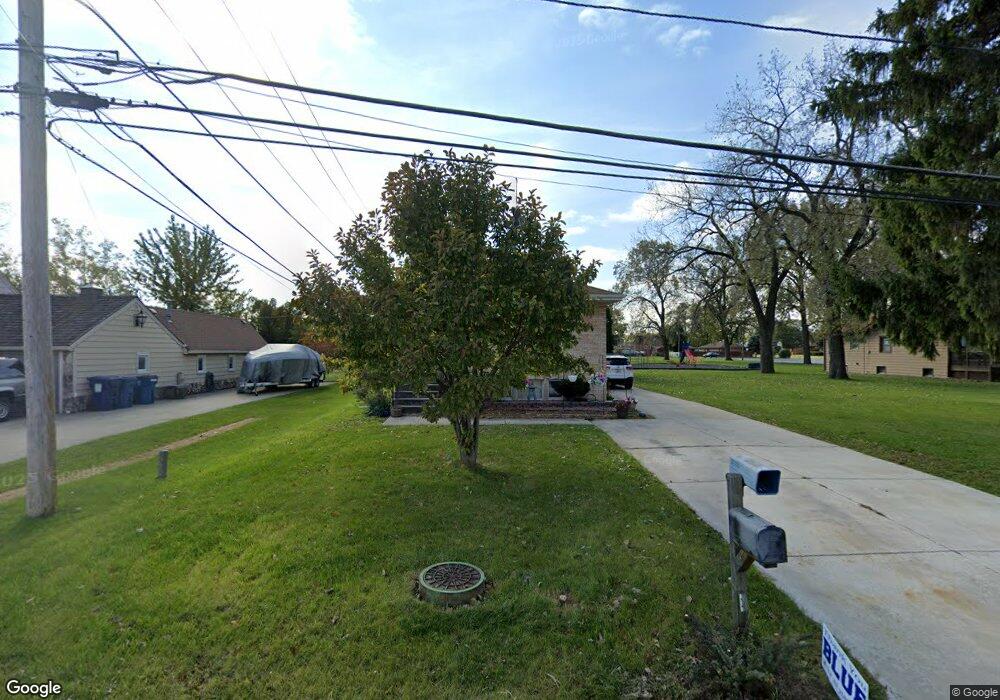
7227 W 74th St Bridgeview, IL 60455
Estimated Value: $356,489 - $497,000
3
Beds
3
Baths
966
Sq Ft
$418/Sq Ft
Est. Value
About This Home
This home is located at 7227 W 74th St, Bridgeview, IL 60455 and is currently estimated at $403,872, approximately $418 per square foot. 7227 W 74th St is a home located in Cook County with nearby schools including Bridgeview Elementary School, Argo Community High School, and Peckwas Preparatory Academy.
Ownership History
Date
Name
Owned For
Owner Type
Purchase Details
Closed on
Feb 10, 2012
Sold by
Marquette Bank
Bought by
Morales Anaid and Morales Erendira
Current Estimated Value
Home Financials for this Owner
Home Financials are based on the most recent Mortgage that was taken out on this home.
Original Mortgage
$216,372
Outstanding Balance
$149,173
Interest Rate
4.25%
Mortgage Type
FHA
Estimated Equity
$254,699
Purchase Details
Closed on
Nov 22, 2004
Sold by
Wisniewski Edmund J and Wisniewski Mary E
Bought by
Marquette Bank and Trust #17418
Purchase Details
Closed on
Mar 30, 1995
Sold by
Sweeney Sharon M
Bought by
Wisniewski Edmund J and Wisniewski Mary E
Home Financials for this Owner
Home Financials are based on the most recent Mortgage that was taken out on this home.
Original Mortgage
$100,000
Interest Rate
8.91%
Create a Home Valuation Report for This Property
The Home Valuation Report is an in-depth analysis detailing your home's value as well as a comparison with similar homes in the area
Home Values in the Area
Average Home Value in this Area
Purchase History
| Date | Buyer | Sale Price | Title Company |
|---|---|---|---|
| Morales Anaid | $222,000 | Pntn | |
| Marquette Bank | -- | -- | |
| Wisniewski Edmund J | $192,000 | -- |
Source: Public Records
Mortgage History
| Date | Status | Borrower | Loan Amount |
|---|---|---|---|
| Open | Morales Anaid | $216,372 | |
| Previous Owner | Wisniewski Edmund J | $100,000 |
Source: Public Records
Tax History
| Year | Tax Paid | Tax Assessment Tax Assessment Total Assessment is a certain percentage of the fair market value that is determined by local assessors to be the total taxable value of land and additions on the property. | Land | Improvement |
|---|---|---|---|---|
| 2025 | $8,863 | $29,000 | $6,750 | $22,250 |
| 2024 | $8,863 | $29,000 | $6,750 | $22,250 |
| 2023 | $6,309 | $29,000 | $6,750 | $22,250 |
| 2022 | $6,309 | $19,203 | $6,000 | $13,203 |
| 2021 | $6,120 | $19,202 | $6,000 | $13,202 |
| 2020 | $6,011 | $19,202 | $6,000 | $13,202 |
| 2019 | $7,266 | $21,061 | $5,625 | $15,436 |
| 2018 | $6,942 | $21,061 | $5,625 | $15,436 |
| 2017 | $6,826 | $21,061 | $5,625 | $15,436 |
| 2016 | $7,113 | $19,867 | $4,875 | $14,992 |
| 2015 | $6,687 | $19,867 | $4,875 | $14,992 |
| 2014 | $6,486 | $19,867 | $4,875 | $14,992 |
| 2013 | $5,921 | $17,367 | $4,875 | $12,492 |
Source: Public Records
Map
Nearby Homes
- 7125 W 74th St
- 7216 S Octavia Ave
- 7153 W 72nd St
- 7000 W 74th St
- 7435 W 74th St
- 7635 S Oconto Ave
- 7332 Beloit Ave
- 7113 W 71st St
- 7545 Beloit Ave
- 7506 S Ferdinand Ave
- 7712 S Oketo Ave
- 7749 Odell Ave
- 7600 S Ferdinand Ave
- 7715 New England Ave
- 7800 New Castle Ave
- 7912 Nordica Ave
- 7214 S 78th Ave
- 7945 S Oketo Ave Unit 404
- 7901 Newland Ave
- 7838 W 73rd Place
- 7306 W 74th St
- 7220 W 74th St
- 7226 W 74th St
- 7210 W 74th St
- 7410 S Harlem Ave
- 7240 W 74th St
- 7240 W 74th St
- 7358 S Harlem Ave
- 7242 W 74th St
- 7244 W 74th St
- 7329 S Octavia Ave
- 7410 S Octavia Ave
- 7301 W 74th St
- 7234 W 75th St
- 7436 S Harlem Ave
- 7414 S Octavia Ave
- 7304 W 74th St
- 7405 S Harlem Ave
- 7323 S Octavia Ave
- 7218 W 75th St
Your Personal Tour Guide
Ask me questions while you tour the home.