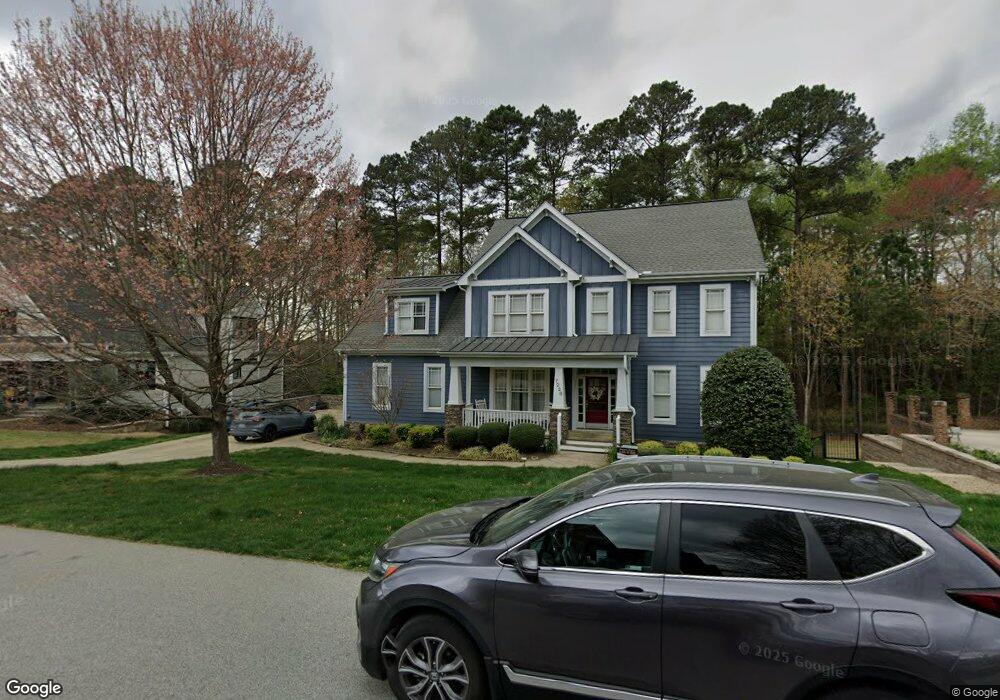
7228 Capulin Crest Dr Apex, NC 27539
Middle Creek NeighborhoodEstimated Value: $698,000 - $778,000
3
Beds
3
Baths
2,510
Sq Ft
$295/Sq Ft
Est. Value
About This Home
This home is located at 7228 Capulin Crest Dr, Apex, NC 27539 and is currently estimated at $739,727, approximately $294 per square foot. 7228 Capulin Crest Dr is a home located in Wake County with nearby schools including West Lake Elementary School, West Lake Middle, and Middle Creek High.
Ownership History
Date
Name
Owned For
Owner Type
Purchase Details
Closed on
Aug 16, 2006
Sold by
New Homes By Custom Construction Inc
Bought by
Bryant Cameron and Bryant Catherine Moga
Current Estimated Value
Home Financials for this Owner
Home Financials are based on the most recent Mortgage that was taken out on this home.
Original Mortgage
$295,676
Outstanding Balance
$172,938
Interest Rate
6.67%
Mortgage Type
Purchase Money Mortgage
Estimated Equity
$566,789
Purchase Details
Closed on
Jan 10, 2006
Sold by
Kerr Smith Homes & Land Inc
Bought by
New Homes By Custom Construction Inc
Purchase Details
Closed on
May 19, 2005
Sold by
Brown John E and Brown Paula L
Bought by
Winslow Properties Development Co
Home Financials for this Owner
Home Financials are based on the most recent Mortgage that was taken out on this home.
Original Mortgage
$800,000
Interest Rate
5.71%
Mortgage Type
Purchase Money Mortgage
Create a Home Valuation Report for This Property
The Home Valuation Report is an in-depth analysis detailing your home's value as well as a comparison with similar homes in the area
Home Values in the Area
Average Home Value in this Area
Purchase History
| Date | Buyer | Sale Price | Title Company |
|---|---|---|---|
| Bryant Cameron | $370,000 | None Available | |
| New Homes By Custom Construction Inc | $137,000 | None Available | |
| Kerr Smith Homes & Land Inc | $796,000 | None Available | |
| Winslow Properties Development Co | -- | None Available |
Source: Public Records
Mortgage History
| Date | Status | Borrower | Loan Amount |
|---|---|---|---|
| Open | Bryant Cameron | $295,676 | |
| Previous Owner | Winslow Properties Development Co | $800,000 |
Source: Public Records
Tax History
| Year | Tax Paid | Tax Assessment Tax Assessment Total Assessment is a certain percentage of the fair market value that is determined by local assessors to be the total taxable value of land and additions on the property. | Land | Improvement |
|---|---|---|---|---|
| 2025 | $6,070 | $705,838 | $145,000 | $560,838 |
| 2024 | $5,876 | $698,333 | $145,000 | $553,333 |
Source: Public Records
Map
Nearby Homes
- 7243 Capulin Crest Dr
- 7224 Bedford Ridge Dr
- 4913 Mashpee Ln
- 7309 Bedford Ridge Dr
- 4412 Fairview Ridge Ln
- 7404 Bedford Ridge Dr
- 7320 Bedford Ridge Dr
- 8649 Glade Hill Dr
- 273 Meadow Beauty Dr
- 5045 Homeplace Dr
- 804 Blue Thorn Dr
- 409 Wanderview Ln
- 212 Sea Biscuit Ln Unit 25
- 3008 Knottsberry Way
- 208 Brookberry Rd
- 4004 Old Sturbridge Dr
- 8224 Bells Lake Rd
- 8220 Bells Lake Rd
- 417 Redhill Rd
- 3909 Langston Cir
- 7224 Capulin Crest Dr
- 7232 Capulin Crest Dr
- 5165 Dove Forest Ln
- 7236 Capulin Crest Dr
- 7220 Capulin Crest Dr
- 7235 Capulin Crest Dr
- 5172 Dove Forest Ln
- 5161 Dove Forest Ln
- 7240 Capulin Crest Dr
- 5168 Dove Forest Ln
- 5168 Dove Forest Ln Unit Lot15
- 7108 Bedford Ridge Dr
- 5112 Roswellcrest Ct
- 7239 Capulin Crest Dr
- 5104 Roswellcrest Ct
- 5164 Dove Forest Ln
- 5157 Dove Forest Ln
- 7216 Capulin Crest Dr
- 7216 Capulin Crest Dr Unit L 149
- 5108 Roswellcrest Ct
Your Personal Tour Guide
Ask me questions while you tour the home.