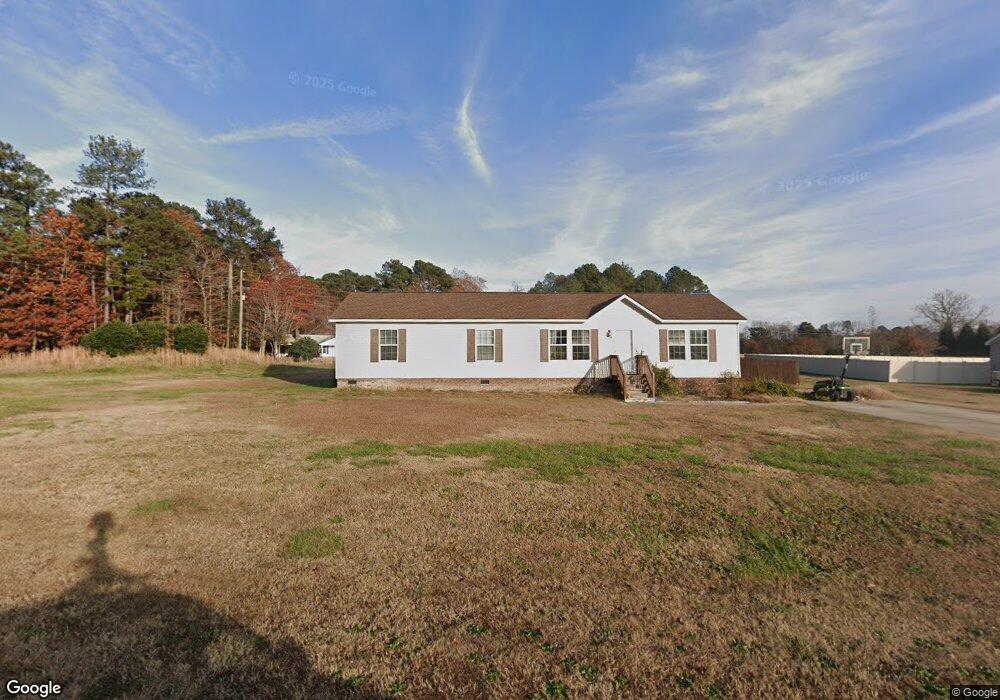
7228 Lowery Meadow Dr Unit 11 Wendell, NC 27591
Estimated Value: $303,420 - $314,000
--
Bed
--
Bath
1,600
Sq Ft
$193/Sq Ft
Est. Value
About This Home
This home is located at 7228 Lowery Meadow Dr Unit 11, Wendell, NC 27591 and is currently estimated at $308,355, approximately $192 per square foot. 7228 Lowery Meadow Dr Unit 11 is a home located in Wake County with nearby schools including Wakelon Elementary School, Zebulon Magnet Middle School, and East Wake High School.
Ownership History
Date
Name
Owned For
Owner Type
Purchase Details
Closed on
May 2, 2017
Sold by
Hocutt Christopher L and Hocutt Carrie A
Bought by
Matthews Charlie Dillon
Current Estimated Value
Home Financials for this Owner
Home Financials are based on the most recent Mortgage that was taken out on this home.
Original Mortgage
$155,555
Outstanding Balance
$129,505
Interest Rate
4.14%
Mortgage Type
New Conventional
Estimated Equity
$178,850
Purchase Details
Closed on
Dec 5, 2014
Sold by
Cmh Parks Inc
Bought by
Hocutt Christopher L and Hocutt Carrie A
Home Financials for this Owner
Home Financials are based on the most recent Mortgage that was taken out on this home.
Original Mortgage
$145,918
Interest Rate
4.09%
Mortgage Type
New Conventional
Create a Home Valuation Report for This Property
The Home Valuation Report is an in-depth analysis detailing your home's value as well as a comparison with similar homes in the area
Home Values in the Area
Average Home Value in this Area
Purchase History
| Date | Buyer | Sale Price | Title Company |
|---|---|---|---|
| Matthews Charlie Dillon | $154,000 | None Available | |
| Hocutt Christopher L | $143,000 | None Available |
Source: Public Records
Mortgage History
| Date | Status | Borrower | Loan Amount |
|---|---|---|---|
| Open | Matthews Charlie Dillon | $155,555 | |
| Previous Owner | Hocutt Christopher L | $145,918 |
Source: Public Records
Tax History Compared to Growth
Tax History
| Year | Tax Paid | Tax Assessment Tax Assessment Total Assessment is a certain percentage of the fair market value that is determined by local assessors to be the total taxable value of land and additions on the property. | Land | Improvement |
|---|---|---|---|---|
| 2025 | $1,739 | $268,692 | $50,000 | $218,692 |
| 2024 | $1,689 | $268,692 | $50,000 | $218,692 |
| 2023 | $1,462 | $184,920 | $40,000 | $144,920 |
| 2022 | $1,355 | $184,920 | $40,000 | $144,920 |
| 2021 | $1,319 | $184,920 | $40,000 | $144,920 |
| 2020 | $1,298 | $184,920 | $40,000 | $144,920 |
| 2019 | $1,345 | $162,266 | $35,000 | $127,266 |
| 2018 | $1,238 | $162,266 | $35,000 | $127,266 |
| 2017 | $1,174 | $162,266 | $35,000 | $127,266 |
| 2016 | $1,150 | $162,266 | $35,000 | $127,266 |
| 2015 | $1,258 | $28,000 | $28,000 | $0 |
| 2014 | $184 | $28,000 | $28,000 | $0 |
Source: Public Records
Map
Nearby Homes
- 1704 Perry Grove Ln
- 6600 Sadie Dr
- 1460 Huntdell Main Dr
- 1127 Edgemont Rd
- 7005 Corfu Place
- 6817 Osprey Landing Dr
- 6001 Winged Willet Ct
- 105 Fox Run Dr
- 633 Rocky Shore Ln
- 500 Whale Cove Dr
- 5545 Cayden Cove Dr
- 2229 Lizard Lick Rd
- 6716 Osprey Landing Dr
- 1236 Turkey Trot Rd
- Davidson Plan at Cayden Cove - Hanover Collection
- Tryon III Plan at Cayden Cove - Summit Collection
- Virginia Plan at Cayden Cove - Cottage Collection
- Landrum III Plan at Cayden Cove - Summit Collection
- Scottsdale Plan at Cayden Cove - Cottage Collection
- Waterbury Plan at Cayden Cove - Cottage Collection
- 7220 Lowery Meadow Dr
- 7220 Lowery Meadow Dr Unit 10
- 2020 Edgemont Rd
- 7216 Lowery Meadow Dr
- 7216 Lowery Meadow Dr Unit 9
- 7225 Lowery Meadow Dr
- 7225 Lowery Meadow Dr Unit 3
- 7229 Lowery Meadow Dr
- 7229 Lowery Meadow Dr Unit 2
- 7233 Lowery Meadow Dr Unit 1
- 7233 Lowery Meadow Dr
- 7217 Lowery Meadow Dr
- 7217 Lowery Meadow Dr Unit 4
- 2001 Edgemont Rd
- 7212 Lowery Meadow Dr
- 7212 Lowery Meadow Dr Unit 8
- 7201 Lowery Meadow Dr
- 7201 Lowery Meadow Dr Unit 5
- 7200 Lowery Meadow Dr
- 7200 Lowery Meadow Dr Unit 7