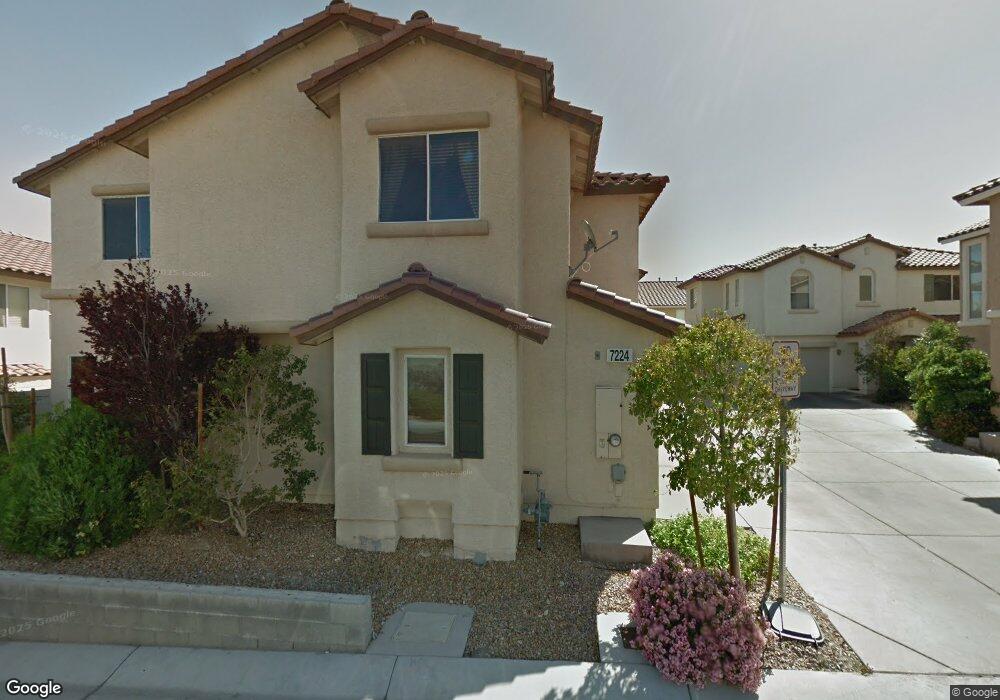
7228 Plushstone St Las Vegas, NV 89148
Estimated Value: $376,000 - $387,000
3
Beds
3
Baths
1,398
Sq Ft
$273/Sq Ft
Est. Value
About This Home
This home is located at 7228 Plushstone St, Las Vegas, NV 89148 and is currently estimated at $382,159, approximately $273 per square foot. 7228 Plushstone St is a home located in Clark County with nearby schools including Wayne N. Tanaka Elementary School, Wilbur & Theresa Faiss Middle School, and Sierra Vista High School.
Ownership History
Date
Name
Owned For
Owner Type
Purchase Details
Closed on
Apr 1, 2008
Sold by
Bank Of America Na
Bought by
Wallek Tom
Current Estimated Value
Purchase Details
Closed on
Sep 5, 2007
Sold by
Pourgouldjian Karine
Bought by
Bank Of America Na
Purchase Details
Closed on
Oct 8, 2003
Sold by
Azakian Akop
Bought by
Pourgouldjian Karine
Home Financials for this Owner
Home Financials are based on the most recent Mortgage that was taken out on this home.
Original Mortgage
$179,450
Interest Rate
6.4%
Mortgage Type
Unknown
Create a Home Valuation Report for This Property
The Home Valuation Report is an in-depth analysis detailing your home's value as well as a comparison with similar homes in the area
Home Values in the Area
Average Home Value in this Area
Purchase History
| Date | Buyer | Sale Price | Title Company |
|---|---|---|---|
| Wallek Tom | $175,000 | First American Title Jones | |
| Bank Of America Na | $184,262 | Fiserv Lending Solutions | |
| Pourgouldjian Karine | -- | Stewart Title Of Nevada | |
| Pourgouldjian Karine | $188,925 | Stewart Title Of Nevada |
Source: Public Records
Mortgage History
| Date | Status | Borrower | Loan Amount |
|---|---|---|---|
| Previous Owner | Pourgouldjian Karine | $179,450 |
Source: Public Records
Tax History Compared to Growth
Tax History
| Year | Tax Paid | Tax Assessment Tax Assessment Total Assessment is a certain percentage of the fair market value that is determined by local assessors to be the total taxable value of land and additions on the property. | Land | Improvement |
|---|---|---|---|---|
| 2025 | $1,435 | $92,597 | $31,500 | $61,097 |
| 2024 | $1,394 | $92,597 | $31,500 | $61,097 |
| 2023 | $1,394 | $89,116 | $31,500 | $57,616 |
| 2022 | $1,353 | $77,063 | $24,500 | $52,563 |
| 2021 | $1,314 | $72,703 | $22,750 | $49,953 |
| 2020 | $1,273 | $72,214 | $22,750 | $49,464 |
| 2019 | $1,235 | $67,893 | $19,250 | $48,643 |
| 2018 | $1,199 | $61,626 | $15,050 | $46,576 |
| 2017 | $1,137 | $61,491 | $14,350 | $47,141 |
| 2016 | $1,137 | $55,817 | $10,850 | $44,967 |
| 2015 | $1,134 | $50,190 | $8,750 | $41,440 |
| 2014 | $1,101 | $36,407 | $5,950 | $30,457 |
Source: Public Records
Map
Nearby Homes
- 9299 Adamshurst Ave
- 9249 Shellmont Ct
- 9272 Keaton Ave
- 7264 Morrison St
- 0 Fort Apache Unit 2719841
- 7011 Azure Beach St
- 7325 Ringquist St
- 9229 Millikan Ave
- 9544 Wild Valley Ave
- 7431 Ademar St
- 9557 Belmont Bay Ave
- 9123 Hilverson Ave
- 9119 Glennon Ave
- 7457 Margollini St
- 9050 W Warm Springs Rd Unit 1164
- 9050 W Warm Springs Rd Unit 1092
- 9050 W Warm Springs Rd Unit 2099
- 7469 Margollini St
- 9100 Hombard Ave
- 9330 W Maule Ave Unit 226
- 7224 Plushstone St
- 9297 Hainsworth Ave
- 7212 Plushstone St
- 7232 Plushstone St
- 9293 Hainsworth Ave
- 7216 Plushstone St
- 7216 Plushstone St
- 7216 Plushstone St
- 7236 Plushstone St
- 9294 Hainsworth Ave
- 9289 Hainsworth Ave
- 9281 Hainsworth Ave
- 7208 Plushstone St
- 7248 Plushstone St
- 9290 Hainsworth Ave
- 7204 Plushstone St
- 7244 Plushstone St
- 9285 Hainsworth Ave
- 9286 Hainsworth Ave
- 9295 Glen Malone Ct