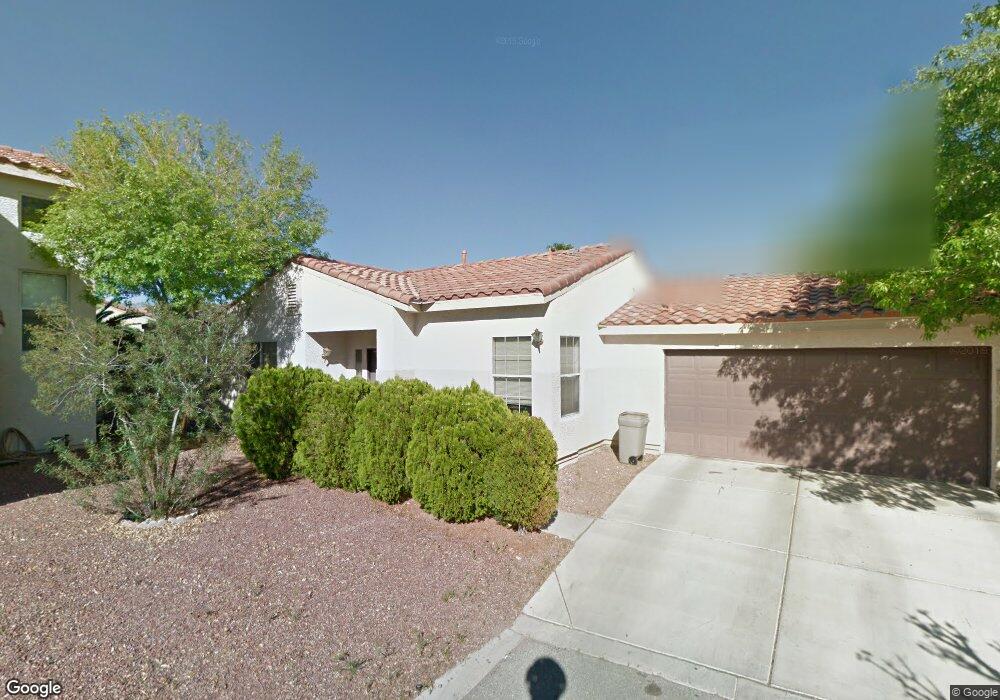
7228 Whisper Heights Ct Las Vegas, NV 89131
Elkhorn Ranch NeighborhoodEstimated Value: $379,413 - $405,000
3
Beds
2
Baths
1,416
Sq Ft
$274/Sq Ft
Est. Value
About This Home
This home is located at 7228 Whisper Heights Ct, Las Vegas, NV 89131 and is currently estimated at $388,353, approximately $274 per square foot. 7228 Whisper Heights Ct is a home located in Clark County with nearby schools including Betsey A Rhodes Elementary School, Ralph Cadwallader Middle School, and Arbor View High School.
Ownership History
Date
Name
Owned For
Owner Type
Purchase Details
Closed on
Nov 17, 2005
Sold by
Eitrem Nadyne P
Bought by
Nadyne P Eitrem Living Trust
Current Estimated Value
Purchase Details
Closed on
Jun 25, 2003
Sold by
Eitrem Gregory O
Bought by
Eitrem Nadyne P
Home Financials for this Owner
Home Financials are based on the most recent Mortgage that was taken out on this home.
Original Mortgage
$133,174
Outstanding Balance
$56,598
Interest Rate
5.37%
Mortgage Type
FHA
Estimated Equity
$331,755
Purchase Details
Closed on
Jun 30, 1997
Sold by
Watt Residential Partners
Bought by
Eitrem Gregory O and Eitrem Nadyne P
Home Financials for this Owner
Home Financials are based on the most recent Mortgage that was taken out on this home.
Original Mortgage
$108,834
Interest Rate
7.91%
Purchase Details
Closed on
May 30, 1997
Sold by
Watt Residential Partners
Bought by
Liebig Douglas A
Home Financials for this Owner
Home Financials are based on the most recent Mortgage that was taken out on this home.
Original Mortgage
$108,834
Interest Rate
7.91%
Create a Home Valuation Report for This Property
The Home Valuation Report is an in-depth analysis detailing your home's value as well as a comparison with similar homes in the area
Home Values in the Area
Average Home Value in this Area
Purchase History
| Date | Buyer | Sale Price | Title Company |
|---|---|---|---|
| Nadyne P Eitrem Living Trust | -- | -- | |
| Eitrem Nadyne P | -- | Land Title Of Nevada | |
| Eitrem Gregory O | $107,000 | First American Title Co | |
| Liebig Douglas A | $105,000 | First American Title Co |
Source: Public Records
Mortgage History
| Date | Status | Borrower | Loan Amount |
|---|---|---|---|
| Open | Eitrem Nadyne P | $133,174 | |
| Closed | Liebig Douglas A | $108,834 |
Source: Public Records
Tax History Compared to Growth
Tax History
| Year | Tax Paid | Tax Assessment Tax Assessment Total Assessment is a certain percentage of the fair market value that is determined by local assessors to be the total taxable value of land and additions on the property. | Land | Improvement |
|---|---|---|---|---|
| 2025 | $1,313 | $80,479 | $28,700 | $51,779 |
| 2024 | $1,307 | $80,479 | $28,700 | $51,779 |
| 2023 | $1,307 | $79,324 | $30,100 | $49,224 |
| 2022 | $1,238 | $68,040 | $23,100 | $44,940 |
| 2021 | $1,202 | $63,870 | $21,000 | $42,870 |
| 2020 | $1,164 | $63,643 | $21,000 | $42,643 |
| 2019 | $1,130 | $60,024 | $17,850 | $42,174 |
| 2018 | $1,097 | $53,814 | $13,300 | $40,514 |
| 2017 | $1,746 | $53,274 | $12,250 | $41,024 |
| 2016 | $1,040 | $50,425 | $9,100 | $41,325 |
| 2015 | $1,037 | $39,709 | $7,000 | $32,709 |
| 2014 | $1,007 | $30,355 | $7,000 | $23,355 |
Source: Public Records
Map
Nearby Homes
- 7208 Whisper Heights Ct
- 8005 Exploration Ave
- 7252 Tigertail Ct
- 7908 Elk Stone Ave
- 7925 High Stream Ave
- 7305 Bosky Springs St
- 7133 Savory St
- 7816 Purple Mountain Ave
- 7817 Falconwing Ave
- 7320 Misty Glow Ct
- 7813 Falconwing Ave
- 7228 Buglehorn St
- 8056 Broken Spur Ln
- 7129 Dillseed Dr
- 8040 Hesperides Ave
- 8037 Radigan Ave
- 7812 Sparrowgate Ave
- 7413 Red Eagle St
- 6868 Sky Pointe Dr Unit 2091
- 6868 Sky Pointe Dr Unit 1038
- 7229 Pinon Crest Ct
- 7232 Whisper Heights Ct
- 7224 Whisper Heights Ct
- 7233 Pinon Crest Ct
- 7233 Whisper Heights Ct
- 7244 Tigertail Ct
- 7225 Pinon Crest Ct Unit 1
- 7245 Wandering Star Ct
- 7240 Tigertail Ct
- 7241 Wandering Star Ct
- 7241 Wandering Star Ct
- 7241 Wandering Star Ct
- 7220 Whisper Heights Ct
- 7232 Pinon Crest Ct
- 7221 Pinon Crest Ct
- 7240 Wandering Star Ct
- 7241 Tigertail Ct
- 7229 Whisper Heights Ct Unit 1
- 7221 Whisper Heights Ct
- 7224 Pinon Crest Ct