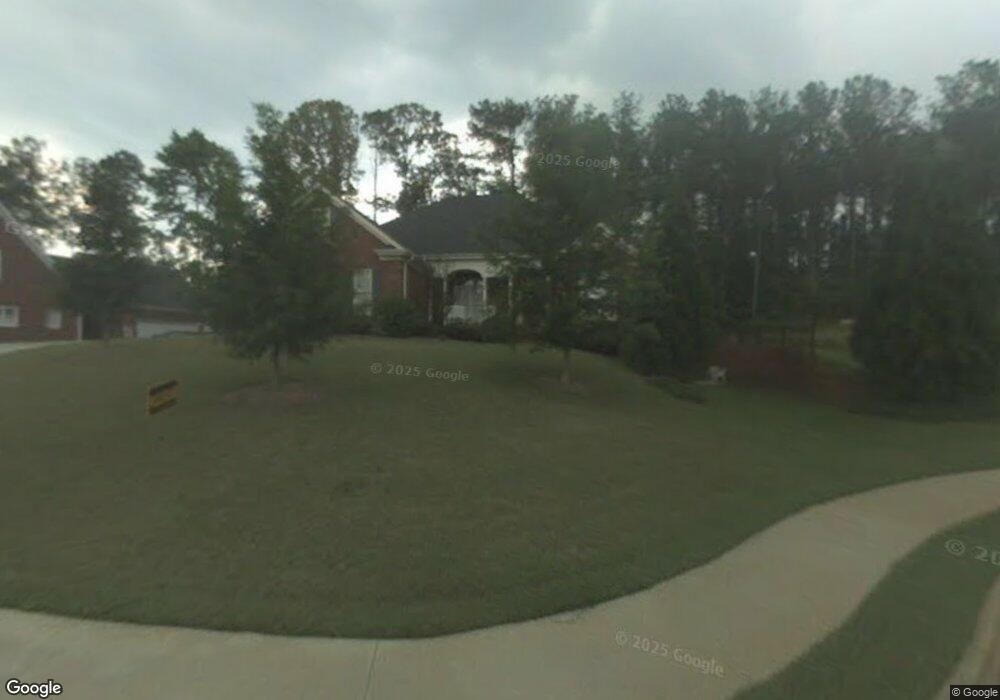
7229 Louise St SE Covington, GA 30014
Estimated Value: $444,445 - $549,000
--
Bed
2
Baths
2,919
Sq Ft
$168/Sq Ft
Est. Value
About This Home
This home is located at 7229 Louise St SE, Covington, GA 30014 and is currently estimated at $490,861, approximately $168 per square foot. 7229 Louise St SE is a home located in Newton County with nearby schools including Middle Ridge Elementary School, Cousins Middle School, and Eastside High School.
Ownership History
Date
Name
Owned For
Owner Type
Purchase Details
Closed on
Oct 30, 2020
Sold by
Huwe Franklin
Bought by
Watterson William R and Watterson Yolanda J
Current Estimated Value
Purchase Details
Closed on
Sep 17, 2011
Sold by
Huwe Franklin R Tru
Bought by
Huwe Franklin R and Watterson William R
Purchase Details
Closed on
Sep 5, 2003
Sold by
Huwe Franklin R
Bought by
Franklin R Huwe Liv
Home Financials for this Owner
Home Financials are based on the most recent Mortgage that was taken out on this home.
Original Mortgage
$207,750
Interest Rate
6.13%
Mortgage Type
New Conventional
Create a Home Valuation Report for This Property
The Home Valuation Report is an in-depth analysis detailing your home's value as well as a comparison with similar homes in the area
Home Values in the Area
Average Home Value in this Area
Purchase History
| Date | Buyer | Sale Price | Title Company |
|---|---|---|---|
| Watterson William R | -- | -- | |
| Huwe Franklin R | -- | -- | |
| Franklin R Huwe Liv | -- | -- | |
| Huwe Franklin R | $259,800 | -- |
Source: Public Records
Mortgage History
| Date | Status | Borrower | Loan Amount |
|---|---|---|---|
| Previous Owner | Huwe Franklin R | $207,750 |
Source: Public Records
Tax History Compared to Growth
Tax History
| Year | Tax Paid | Tax Assessment Tax Assessment Total Assessment is a certain percentage of the fair market value that is determined by local assessors to be the total taxable value of land and additions on the property. | Land | Improvement |
|---|---|---|---|---|
| 2024 | $5,772 | $191,160 | $24,800 | $166,360 |
| 2023 | $5,716 | $175,880 | $8,800 | $167,080 |
| 2022 | $4,789 | $147,360 | $8,800 | $138,560 |
| 2021 | $4,890 | $134,640 | $8,800 | $125,840 |
| 2020 | $4,362 | $112,640 | $6,000 | $106,640 |
| 2019 | $3,963 | $100,800 | $6,000 | $94,800 |
| 2018 | $3,769 | $94,960 | $6,000 | $88,960 |
| 2017 | $3,109 | $78,920 | $6,000 | $72,920 |
| 2016 | $2,981 | $75,800 | $6,000 | $69,800 |
| 2015 | $2,731 | $69,640 | $6,000 | $63,640 |
| 2014 | $2,733 | $69,640 | $0 | $0 |
Source: Public Records
Map
Nearby Homes
- 8193 Monticello St
- 8239 High Lake Terrace SE
- 10110 Malcolm Ct
- 6111 Old Monticello St SE
- 10155 Malcolm Dr
- 10183 N Links Dr
- 0 Petty St Unit 10547316
- 0 Petty St Unit 7640177
- 7155 Petty St SW
- 10184 Malcolm Dr
- 6176 Pinewood Dr SE
- 322 Pinewood Dr
- 6169 Pinewood Dr SE
- 8384 Fairway Dr
- 6134 Linwood Dr SE
- 7120 Chaney Dr SW
- 8370 Fairway Dr
- 6129 Linwood Dr SE
- 10119 Azalea Dr
- 7219 Louise St SE
- 7237 Louise St SE
- 7226 Louise St SE
- 7214 Louise St SE
- 8288 Wood St SE
- 8281 Wood St SE
- 8154 Woodland Ave SE
- 0 Martha Ct SE
- 8146 Woodland Ave SE
- 7199 Louise St SE
- 8162 Woodland Ave SE
- 8130 Woodland Ave SE Unit 2B
- 8170 Woodland Ave SE
- 7111 Martha Ct SE
- 0 Marthas Ct Unit 3174671
- 8122 Woodland Ave SE
- 8278 Wood St SE
- 8106 Primrose Cove SE
- 8178 Woodland Ave SE Unit 2B
- 8116 Primrose Cove SE