
Seller's Agent in 2024
Logan Bronson
RE/MAX
(800) 525-7452
206 in this area
261 Total Sales
Estimated Value: $286,000 - $312,000
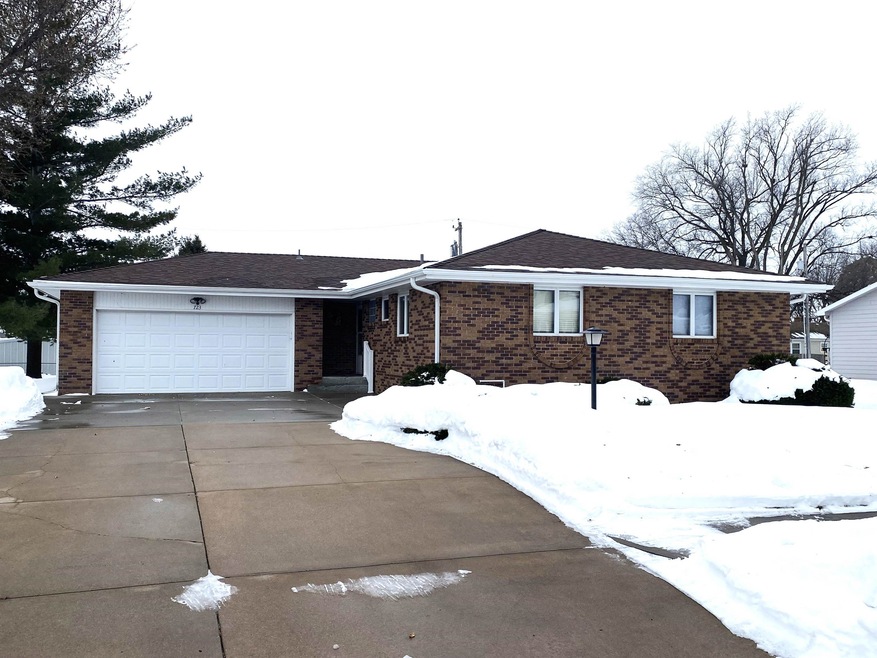
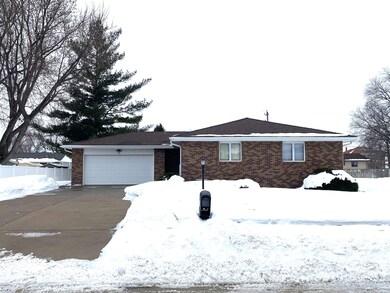
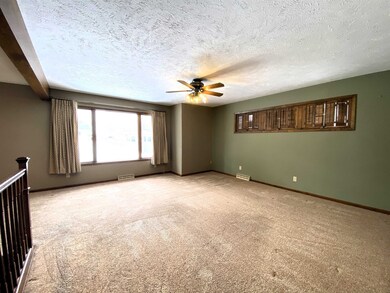
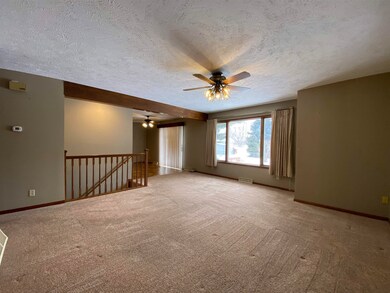
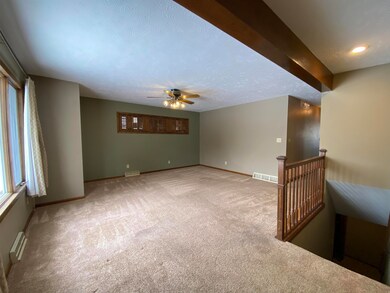
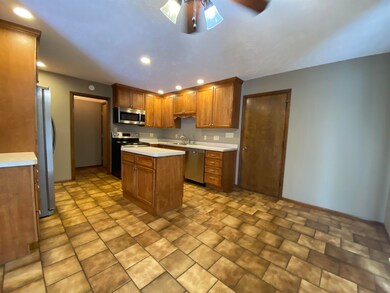
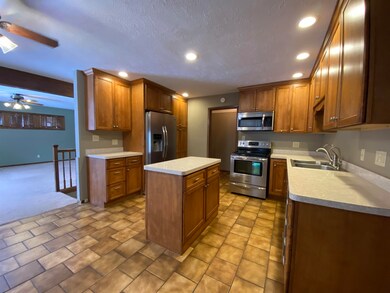
TAKE A LOOK AT THIS BEAUTIFULLY DONE 3 BEDROOM TWO BATH HOME LOCATED ON THE SOUTH SIDE OF COLUMBUS. QAULTY SHOWS WHEN YOU TAKE A WALK THROUGH THIS SOLID HOME. FROM THE CUSTOM KITCHEN DOWN TO THE BRICK EXTERIOR AND BRICK ACCENTS IN THE BASEMENT. NEWER STAINLESS APPLIANCES IN THE KITCHEN. BACKYARD HAS A NICE PATIO AREA FOR ENTERTAINING. BASEMENT HAS A WORKING FIREPLACE, HOWEVER THE TOP DOES HAVE A CAP THAT NEEDS REMOVED. CALL AND SETUP A SHOWING TODAY. HOME IS BEING SOLD IN A TRUST.
Last Agent to Sell the Property
RE/MAX TOTAL REALTY License #20160405 Listed on: 01/22/2024
| Date | Buyer | Sale Price | Title Company |
|---|---|---|---|
| Diamond Lloyd S | -- | Platte County Title |
| Date | Event | Price | List to Sale | Price per Sq Ft | Prior Sale |
|---|---|---|---|---|---|
| 03/08/2024 03/08/24 | Sold | $300,000 | -4.8% | $225 / Sq Ft | |
| 02/12/2024 02/12/24 | Pending | -- | -- | -- | |
| 01/22/2024 01/22/24 | For Sale | $315,000 | +70.3% | $236 / Sq Ft | |
| 04/01/2014 04/01/14 | Sold | $185,000 | -3.4% | $138 / Sq Ft | View Prior Sale |
| 01/25/2014 01/25/14 | Pending | -- | -- | -- | |
| 08/19/2013 08/19/13 | For Sale | $191,500 | -- | $143 / Sq Ft |
| Year | Tax Paid | Tax Assessment Tax Assessment Total Assessment is a certain percentage of the fair market value that is determined by local assessors to be the total taxable value of land and additions on the property. | Land | Improvement |
|---|---|---|---|---|
| 2025 | $3,948 | $273,805 | $35,380 | $238,425 |
| 2024 | $3,948 | $298,195 | $27,215 | $270,980 |
| 2023 | $4,085 | $238,420 | $27,215 | $211,205 |
| 2022 | $3,792 | $212,670 | $27,215 | $185,455 |
| 2021 | $3,779 | $212,670 | $27,215 | $185,455 |
| 2020 | $3,562 | $196,385 | $27,215 | $169,170 |
| 2019 | $3,240 | $181,005 | $27,215 | $153,790 |
| 2018 | $2,939 | $159,985 | $24,215 | $135,770 |
| 2017 | $2,907 | $159,985 | $24,215 | $135,770 |
| 2016 | $2,925 | $159,985 | $24,215 | $135,770 |
| 2015 | $2,952 | $159,985 | $24,215 | $135,770 |
| 2014 | $2,648 | $140,395 | $18,160 | $122,235 |
| 2012 | -- | $140,395 | $18,160 | $122,235 |
Seller's Agent in 2024
Logan Bronson
RE/MAX
(800) 525-7452
206 in this area
261 Total Sales
Buyer's Agent in 2024
Jose Garcia
RE/MAX
(402) 942-2346
145 in this area
160 Total Sales
R
Seller's Agent in 2014
RITA INGOLD
CAPSTONE REALTY
S
Buyer's Agent in 2014
STEPHANIE EBNER
RE/MAX
Source: Columbus Board of REALTORS® (NE)
MLS Number: 20240026
APN: 710096705