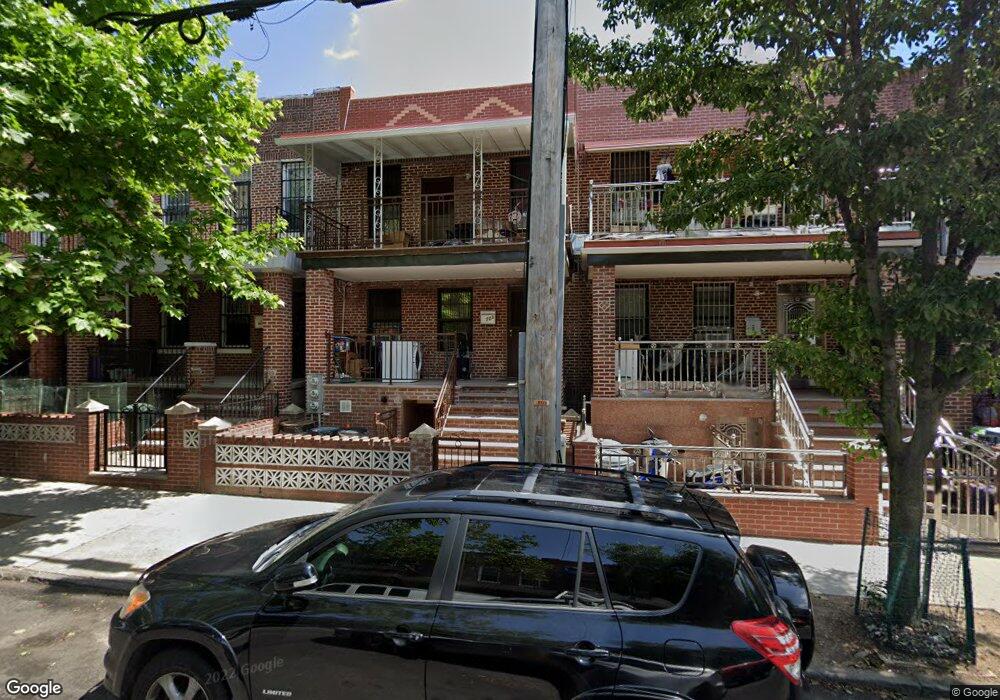
723 47th St Brooklyn, NY 11220
Sunset Park NeighborhoodEstimated Value: $1,458,930 - $1,623,000
--
Bed
--
Bath
2,146
Sq Ft
$727/Sq Ft
Est. Value
About This Home
This home is located at 723 47th St, Brooklyn, NY 11220 and is currently estimated at $1,559,233, approximately $726 per square foot. 723 47th St is a home located in Kings County with nearby schools including P.S. 169 Sunset Park, I.S. 223 The Montauk, and Kehilath Yakov Pupa.
Ownership History
Date
Name
Owned For
Owner Type
Purchase Details
Closed on
Nov 9, 2017
Sold by
Chen Zeng Jin and Chen Zhu Guan
Bought by
Chen Fanny and Chen Hua Ren
Current Estimated Value
Purchase Details
Closed on
Aug 22, 2001
Sold by
Musallam Raja A and Musallam Sarah R
Bought by
Chen Zhu Guan and Chen Zeng Jin
Home Financials for this Owner
Home Financials are based on the most recent Mortgage that was taken out on this home.
Original Mortgage
$315,000
Interest Rate
6.99%
Create a Home Valuation Report for This Property
The Home Valuation Report is an in-depth analysis detailing your home's value as well as a comparison with similar homes in the area
Home Values in the Area
Average Home Value in this Area
Purchase History
| Date | Buyer | Sale Price | Title Company |
|---|---|---|---|
| Chen Fanny | -- | -- | |
| Chen Zhu Guan | -- | -- |
Source: Public Records
Mortgage History
| Date | Status | Borrower | Loan Amount |
|---|---|---|---|
| Previous Owner | Chen Zhu Guan | $315,000 |
Source: Public Records
Tax History Compared to Growth
Tax History
| Year | Tax Paid | Tax Assessment Tax Assessment Total Assessment is a certain percentage of the fair market value that is determined by local assessors to be the total taxable value of land and additions on the property. | Land | Improvement |
|---|---|---|---|---|
| 2025 | $8,236 | $93,480 | $25,980 | $67,500 |
| 2024 | $8,236 | $85,320 | $25,980 | $59,340 |
| 2023 | $8,328 | $83,520 | $25,980 | $57,540 |
| 2022 | $6,093 | $81,240 | $25,980 | $55,260 |
| 2021 | $8,069 | $70,020 | $25,980 | $44,040 |
| 2020 | $6,060 | $77,160 | $25,980 | $51,180 |
| 2019 | $7,148 | $76,860 | $25,980 | $50,880 |
| 2018 | $6,966 | $34,172 | $9,664 | $24,508 |
| 2017 | $6,913 | $33,912 | $12,402 | $21,510 |
| 2016 | $6,396 | $31,993 | $12,056 | $19,937 |
| 2015 | $3,639 | $30,183 | $13,368 | $16,815 |
| 2014 | $3,639 | $28,477 | $13,416 | $15,061 |
Source: Public Records
Map
Nearby Homes