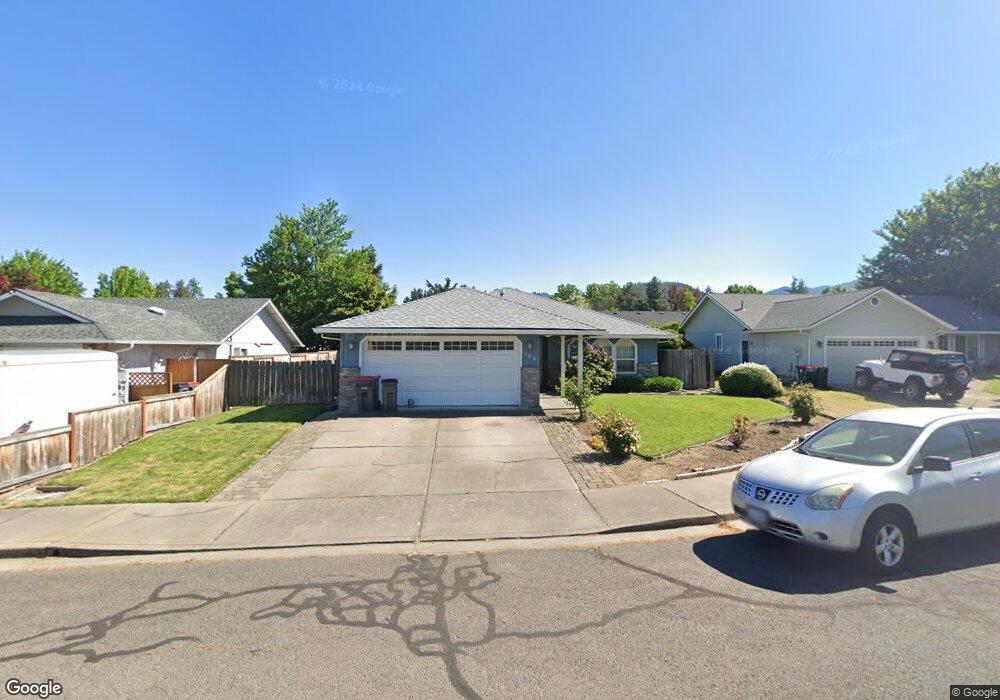
723 Alyssa Cir Phoenix, OR 97535
Estimated Value: $366,000 - $403,000
3
Beds
2
Baths
1,488
Sq Ft
$257/Sq Ft
Est. Value
About This Home
This home is located at 723 Alyssa Cir, Phoenix, OR 97535 and is currently estimated at $382,724, approximately $257 per square foot. 723 Alyssa Cir is a home located in Jackson County with nearby schools including Phoenix Elementary School, Talent Middle School, and Phoenix High School.
Ownership History
Date
Name
Owned For
Owner Type
Purchase Details
Closed on
Aug 21, 2003
Sold by
Arthur Matthew Richard
Bought by
Arthur Matthew Richard and Arthur Jill Ann
Current Estimated Value
Purchase Details
Closed on
Oct 19, 2000
Sold by
Wemple Alan J and Wemple Elaine A
Bought by
Arthur Matthew Richard
Home Financials for this Owner
Home Financials are based on the most recent Mortgage that was taken out on this home.
Original Mortgage
$118,000
Outstanding Balance
$41,206
Interest Rate
7.89%
Estimated Equity
$341,518
Create a Home Valuation Report for This Property
The Home Valuation Report is an in-depth analysis detailing your home's value as well as a comparison with similar homes in the area
Home Values in the Area
Average Home Value in this Area
Purchase History
We collect this data history from publicly available records. To have your information removed, we recommend requesting removal directly through your county’s website.
| Date | Buyer | Sale Price | Title Company |
|---|---|---|---|
| Arthur Matthew Richard | -- | -- | |
| Arthur Matthew Richard | $135,000 | Jackson County Title |
Source: Public Records
Mortgage History
We collect this data history from publicly available records. To have your information removed, we recommend requesting removal directly through your county’s website.
| Date | Status | Borrower | Loan Amount |
|---|---|---|---|
| Open | Arthur Matthew Richard | $118,000 |
Source: Public Records
Tax History
| Year | Tax Paid | Tax Assessment Tax Assessment Total Assessment is a certain percentage of the fair market value that is determined by local assessors to be the total taxable value of land and additions on the property. | Land | Improvement |
|---|---|---|---|---|
| 2026 | $3,261 | $204,470 | -- | -- |
| 2025 | $3,183 | $198,520 | $57,980 | $140,540 |
| 2024 | $3,183 | $192,740 | $56,290 | $136,450 |
| 2023 | $3,084 | $187,130 | $54,660 | $132,470 |
| 2022 | $3,002 | $187,130 | $54,660 | $132,470 |
| 2021 | $2,930 | $181,680 | $53,070 | $128,610 |
| 2020 | $2,838 | $176,390 | $51,520 | $124,870 |
| 2019 | $2,762 | $166,280 | $48,580 | $117,700 |
| 2018 | $2,681 | $161,440 | $47,170 | $114,270 |
| 2017 | $2,533 | $161,440 | $47,170 | $114,270 |
| 2016 | $2,465 | $152,180 | $44,450 | $107,730 |
| 2015 | $2,369 | $152,180 | $44,450 | $107,730 |
| 2014 | $2,279 | $143,450 | $41,900 | $101,550 |
Source: Public Records
Map
Nearby Homes
- 3712 Colver Rd
- 113 Skyler Ln
- 1620 Pacific Ln
- 102 Elm St
- 130 Sharon Dr
- 113 Houston Rd
- 124 Samuel Ln
- 0 Colver Rd
- 3985 Calhoun Rd
- 817 Amerman Dr
- 215 S C St
- 431 Elm St
- 457 Elm St
- 110 W 5th St
- 4624 S Pacific Hwy Unit 17
- 600 N Main St
- 610 N Main St Unit 5A
- 612 N Main St
- 300 Luman Rd Unit 197
- 300 Luman Rd Unit 200
Your Personal Tour Guide
Ask me questions while you tour the home.