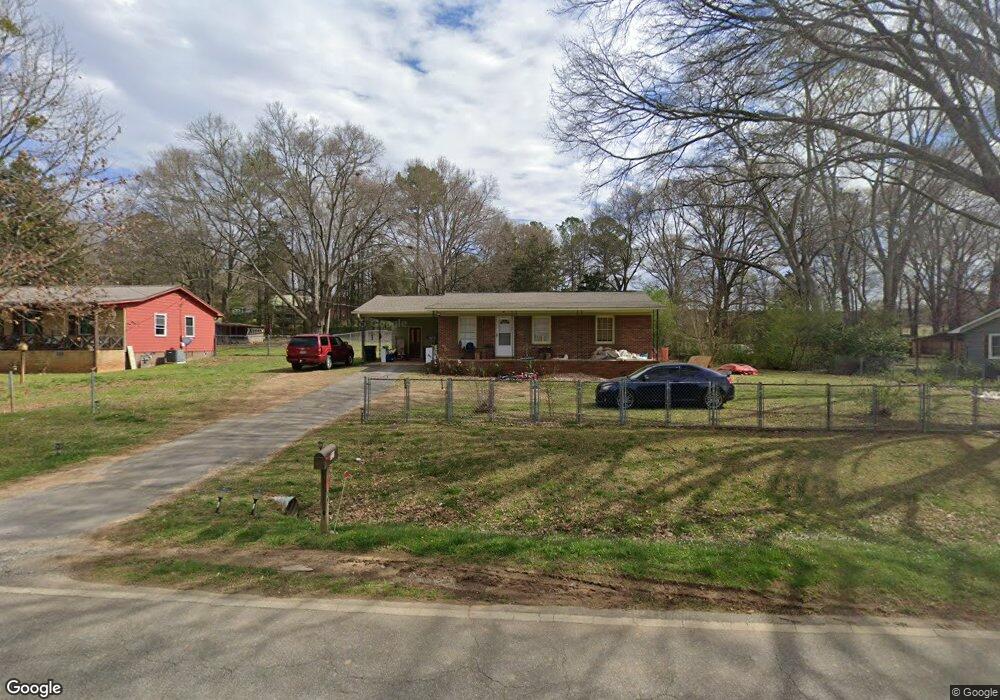
723 Antioch Rd Cedartown, GA 30125
Estimated Value: $139,955 - $159,000
3
Beds
1
Bath
1,200
Sq Ft
$125/Sq Ft
Est. Value
About This Home
This home is located at 723 Antioch Rd, Cedartown, GA 30125 and is currently estimated at $149,739, approximately $124 per square foot. 723 Antioch Rd is a home located in Polk County with nearby schools including Cedar Christian School.
Ownership History
Date
Name
Owned For
Owner Type
Purchase Details
Closed on
Apr 26, 2005
Sold by
Sec Of Housing & U
Bought by
Phillips Dennis
Current Estimated Value
Purchase Details
Closed on
Sep 7, 2004
Sold by
Washington Mutual Bank Fa
Bought by
Secretary Of Housing & Urban Development
Purchase Details
Closed on
Oct 26, 2001
Sold by
Whatley Franklin
Bought by
Cook Sandra
Purchase Details
Closed on
May 27, 2000
Sold by
Shelton Edward L
Bought by
Whatley Franklin E
Purchase Details
Closed on
Apr 20, 2000
Sold by
Whatley Bruce E
Bought by
Whatley Franklin E
Purchase Details
Closed on
Jan 5, 1996
Sold by
Whatley Lessie Fka Lessie Sanders
Bought by
Whatley Charles Edward and Whatley Franklin E
Purchase Details
Closed on
Apr 13, 1973
Sold by
Frady Ernest L
Bought by
Sanders Lessie Mae
Purchase Details
Closed on
Jun 28, 1972
Sold by
Anderson Joseph N
Bought by
Frady Ernest L
Purchase Details
Closed on
Aug 31, 1971
Sold by
Lynn Gammage Ltd
Bought by
Anderson Joseph N
Purchase Details
Closed on
Sep 21, 1970
Bought by
Lynn Gammage Ltd
Create a Home Valuation Report for This Property
The Home Valuation Report is an in-depth analysis detailing your home's value as well as a comparison with similar homes in the area
Home Values in the Area
Average Home Value in this Area
Purchase History
| Date | Buyer | Sale Price | Title Company |
|---|---|---|---|
| Phillips Dennis | -- | -- | |
| Secretary Of Housing & Urban Development | -- | -- | |
| Washington Mutual Bank Fa | -- | -- | |
| Cook Sandra | $62,400 | -- | |
| Whatley Franklin E | -- | -- | |
| Whatley Franklin E | -- | -- | |
| Whatley Charles Edward | -- | -- | |
| Sanders Lessie Mae | -- | -- | |
| Frady Ernest L | -- | -- | |
| Anderson Joseph N | -- | -- | |
| Lynn Gammage Ltd | -- | -- |
Source: Public Records
Tax History Compared to Growth
Tax History
| Year | Tax Paid | Tax Assessment Tax Assessment Total Assessment is a certain percentage of the fair market value that is determined by local assessors to be the total taxable value of land and additions on the property. | Land | Improvement |
|---|---|---|---|---|
| 2024 | $785 | $37,535 | $10,000 | $27,535 |
| 2023 | $521 | $21,941 | $4,000 | $17,941 |
| 2022 | $464 | $19,546 | $4,000 | $15,546 |
| 2021 | $490 | $20,386 | $4,840 | $15,546 |
| 2020 | $491 | $20,386 | $4,840 | $15,546 |
| 2019 | $509 | $18,945 | $3,146 | $15,799 |
| 2018 | $509 | $18,458 | $3,146 | $15,312 |
| 2017 | $502 | $18,458 | $3,146 | $15,312 |
| 2016 | $502 | $18,458 | $3,146 | $15,312 |
| 2015 | $513 | $18,783 | $3,146 | $15,637 |
| 2014 | $493 | $17,938 | $2,301 | $15,637 |
Source: Public Records
Map
Nearby Homes
- 766 Antioch Rd
- 480 Cason Rd
- 255 Mildred Dr
- 35 Old Mill Rd
- 1987 Buchanan Hwy
- 00 Buchanan Hwy
- 95 Wieuca Way
- 240 Benedict Loop
- 142 Acres On Judkin Mill Rd
- 203 Cason Rd
- 000 Wieuca Way
- 0 Wieuca Way Unit 10614129
- 117 Cason Rd
- 205 Pinecrest Rd
- 160 Tate Rd
- 149 Irwin St
- 9236 Tallapoosa Hwy
- 0 Coaling Rd Unit 9221-D 10352096
- 0 Coaling Rd Unit 9221-C 10352086
- 0 Coaling Rd Unit 9221 10352063
- 715 Antioch Rd
- 735 Antioch Rd
- 00 Johnson Cir
- 743 Antioch Rd
- 703 Antioch Rd
- 121 Johnson Cir
- 753 Antioch Rd
- 722 Antioch Rd
- 685 Antioch Rd
- 111 Johnson Cir
- 750 Antioch Rd
- 765 Antioch Rd
- 781 Antioch Rd
- 95 Johnson Cir
- 671 Antioch Rd
- 783 Antioch Rd
- 732 Antioch Rd
- 79 Johnson Cir
- 656 Antioch Rd
- 655 Antioch Rd