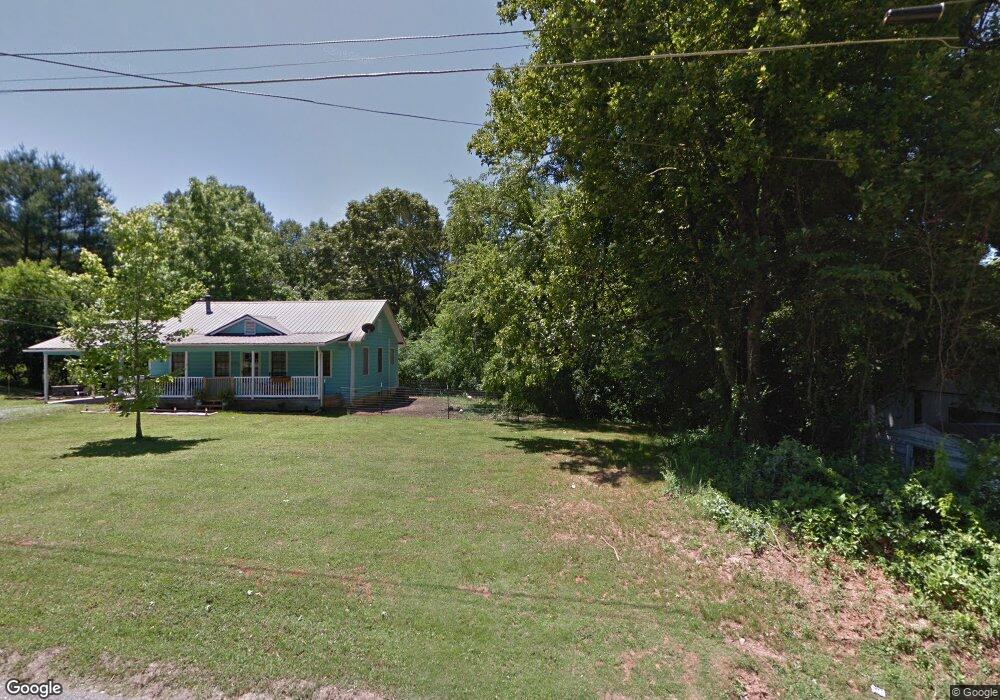
723 Bugscuffle Rd Hiawassee, GA 30546
Estimated Value: $170,000 - $337,000
--
Bed
--
Bath
896
Sq Ft
$268/Sq Ft
Est. Value
About This Home
This home is located at 723 Bugscuffle Rd, Hiawassee, GA 30546 and is currently estimated at $240,333, approximately $268 per square foot. 723 Bugscuffle Rd is a home with nearby schools including Towns County Elementary School, Towns County Middle School, and Towns County High School.
Ownership History
Date
Name
Owned For
Owner Type
Purchase Details
Closed on
Mar 29, 2021
Sold by
Gulino Megan H
Bought by
Lim Kuy
Current Estimated Value
Purchase Details
Closed on
Sep 9, 2020
Sold by
Fun Coast Investment Properties Llc
Bought by
Gulino Megan H and Gulino Joseph
Home Financials for this Owner
Home Financials are based on the most recent Mortgage that was taken out on this home.
Original Mortgage
$98,188
Interest Rate
2.9%
Mortgage Type
FHA
Purchase Details
Closed on
Jul 20, 2018
Sold by
Young Evelyn Gunn
Bought by
Fun Coast Investment Properties Llc
Home Financials for this Owner
Home Financials are based on the most recent Mortgage that was taken out on this home.
Original Mortgage
$55,000
Interest Rate
4.5%
Mortgage Type
New Conventional
Purchase Details
Closed on
Jan 30, 1998
Bought by
Frye Nell Oglesby
Create a Home Valuation Report for This Property
The Home Valuation Report is an in-depth analysis detailing your home's value as well as a comparison with similar homes in the area
Home Values in the Area
Average Home Value in this Area
Purchase History
| Date | Buyer | Sale Price | Title Company |
|---|---|---|---|
| Lim Kuy | $113,000 | -- | |
| Gulino Megan H | $100,000 | -- | |
| Fun Coast Investment Properties Llc | $46,000 | -- | |
| Frye Nell Oglesby | $20,000 | -- |
Source: Public Records
Mortgage History
| Date | Status | Borrower | Loan Amount |
|---|---|---|---|
| Previous Owner | Gulino Megan H | $98,188 | |
| Previous Owner | Fun Coast Investment Properties Llc | $55,000 |
Source: Public Records
Tax History Compared to Growth
Tax History
| Year | Tax Paid | Tax Assessment Tax Assessment Total Assessment is a certain percentage of the fair market value that is determined by local assessors to be the total taxable value of land and additions on the property. | Land | Improvement |
|---|---|---|---|---|
| 2024 | $941 | $87,659 | $8,494 | $79,165 |
| 2023 | $860 | $73,368 | $6,795 | $66,573 |
| 2022 | $792 | $67,575 | $5,662 | $61,913 |
| 2021 | $633 | $52,478 | $3,630 | $48,848 |
| 2020 | $205 | $15,977 | $3,630 | $12,347 |
| 2019 | $233 | $17,901 | $3,630 | $14,271 |
| 2018 | $232 | $17,354 | $3,630 | $13,724 |
| 2017 | $231 | $16,688 | $3,672 | $13,016 |
| 2016 | $231 | $16,688 | $3,672 | $13,016 |
| 2015 | $234 | $16,688 | $3,672 | $13,016 |
| 2014 | $236 | $16,688 | $3,672 | $13,016 |
| 2013 | -- | $16,688 | $3,672 | $13,016 |
Source: Public Records
Map
Nearby Homes
- 4.78 AC Hawkview
- 905 Johnson Rd
- 15 A&a Dr
- LOT 12 Rainbow Ridge Rd
- 1458 Montana Ln
- #10 Spaniard Point Rd
- #4 Stonecrest Cir
- 1870 Hwy 75n
- 985 Vista Ln
- #20 Victoria Woods Cir
- 11 the Ridges Bill Bro
- Lot 9 Wolfpen Gap
- 10 the Ridges Bill Bro
- Lot 19 Bear Trail
- 523 Sunnyside Shores Rd
- Lot 10 Bend of the River Rd
- LT 115 Ridge Wood Trail
- 2520 Road 4748
- 2385 Road 4748
- 98 Brett Way
- 835 Bugscuffle Rd
- 816 Bugscuffle Rd
- 2062 Bugscuffle Rd
- 648 Kimsey Cove Rd
- 824 Bugscuffle Rd
- 809 Bugscuffle Rd
- 867 Bugscuffle Rd
- 1627 Konahetah Dr
- 0 Lot 2 3 4 Wood Cliff
- 800 Bugscuffle Rd
- 1626 Konahetah Dr
- 628 Kimsey Cove Rd
- 913 Johnson Rd
- Lt 9 McRidge Rd
- 1624 Konahetah Dr Unit 86
- 1624 Konahetah Dr
- 1623 Konahetah Dr
- 614 Kimsey Cove Rd
- 629 Kimsey Cove Rd
- 908 Johnson Rd