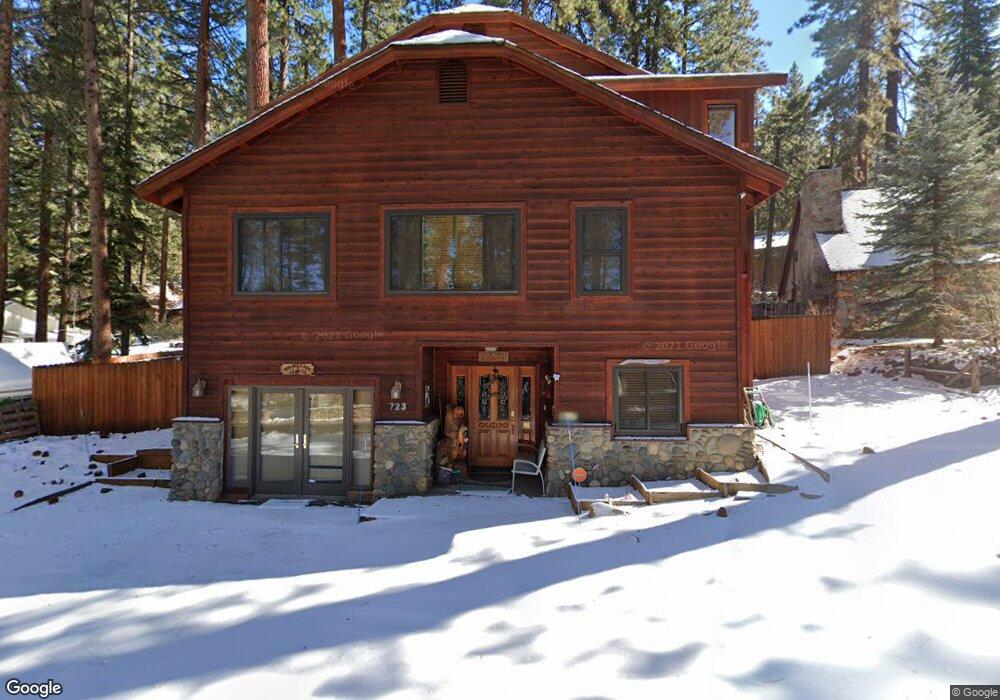
723 Cedar St Zephyr Cove, NV 89448
Estimated Value: $1,370,037 - $1,977,000
--
Bed
--
Bath
1,526
Sq Ft
$1,050/Sq Ft
Est. Value
About This Home
This home is located at 723 Cedar St, Zephyr Cove, NV 89448 and is currently estimated at $1,602,759, approximately $1,050 per square foot. 723 Cedar St is a home with nearby schools including Zephyr Cove Elementary School, George Whittell High School, and Douglas County High School.
Ownership History
Date
Name
Owned For
Owner Type
Purchase Details
Closed on
May 17, 2021
Sold by
Murphy Tracy K and Murphy James E
Bought by
Murphy James E and Murphy Tracy K
Current Estimated Value
Home Financials for this Owner
Home Financials are based on the most recent Mortgage that was taken out on this home.
Original Mortgage
$548,250
Outstanding Balance
$413,511
Interest Rate
2.9%
Mortgage Type
New Conventional
Estimated Equity
$1,189,248
Purchase Details
Closed on
Mar 19, 2013
Sold by
Murphy James E and Murphy Tracy K
Bought by
Murphy James E and Murphy Tracy K
Purchase Details
Closed on
Sep 27, 2005
Sold by
Murphy James E and Murphy Tracy K
Bought by
Murphy James E and Murphy Tracy K
Home Financials for this Owner
Home Financials are based on the most recent Mortgage that was taken out on this home.
Original Mortgage
$835,000
Interest Rate
5.72%
Mortgage Type
New Conventional
Create a Home Valuation Report for This Property
The Home Valuation Report is an in-depth analysis detailing your home's value as well as a comparison with similar homes in the area
Home Values in the Area
Average Home Value in this Area
Purchase History
| Date | Buyer | Sale Price | Title Company |
|---|---|---|---|
| Murphy James E | -- | Amrock Llc | |
| Murphy Tracy K | -- | Amrock Llc | |
| Murphy James E | -- | None Available | |
| Murphy James E | -- | First Centennial Title |
Source: Public Records
Mortgage History
| Date | Status | Borrower | Loan Amount |
|---|---|---|---|
| Open | Murphy Tracy K | $548,250 | |
| Previous Owner | Murphy James E | $835,000 |
Source: Public Records
Tax History Compared to Growth
Tax History
| Year | Tax Paid | Tax Assessment Tax Assessment Total Assessment is a certain percentage of the fair market value that is determined by local assessors to be the total taxable value of land and additions on the property. | Land | Improvement |
|---|---|---|---|---|
| 2025 | $5,625 | $257,516 | $183,750 | $73,766 |
| 2024 | $5,625 | $258,293 | $183,750 | $74,543 |
| 2023 | $5,490 | $253,541 | $183,750 | $69,791 |
| 2022 | $5,296 | $230,003 | $164,500 | $65,503 |
| 2021 | $5,136 | $211,235 | $148,750 | $62,485 |
| 2020 | $4,968 | $210,211 | $148,750 | $61,461 |
| 2019 | $4,788 | $188,496 | $127,750 | $60,746 |
| 2018 | $4,570 | $181,665 | $122,500 | $59,165 |
| 2017 | $4,391 | $181,983 | $122,500 | $59,483 |
| 2016 | $4,282 | $182,938 | $122,500 | $60,438 |
| 2015 | $4,273 | $182,938 | $122,500 | $60,438 |
| 2014 | $4,141 | $178,979 | $122,500 | $56,479 |
Source: Public Records
Map
Nearby Homes
- 670 Riven Rock Rd
- 733 Lakeview Dr
- 227 S Martin Dr
- 606 Jerry Dr
- 664 Lookout Rd
- 605 Jerry Dr
- 621 Lakeview Dr
- 5 Ute Ct
- 225 S Martin Dr
- 259 Mc Faul Ct
- 600 U S 50 Unit 60
- 625 Lake Shore Blvd
- 644 Job Ln
- 450 Mcfaul Way Unit 17
- 464 Elks Ave
- 458 Center St
- 130 Ponderosa Dr
- 112 Ponderosa Cir
- 128 Holly Ln Unit B
- 230 Clubhouse Cir