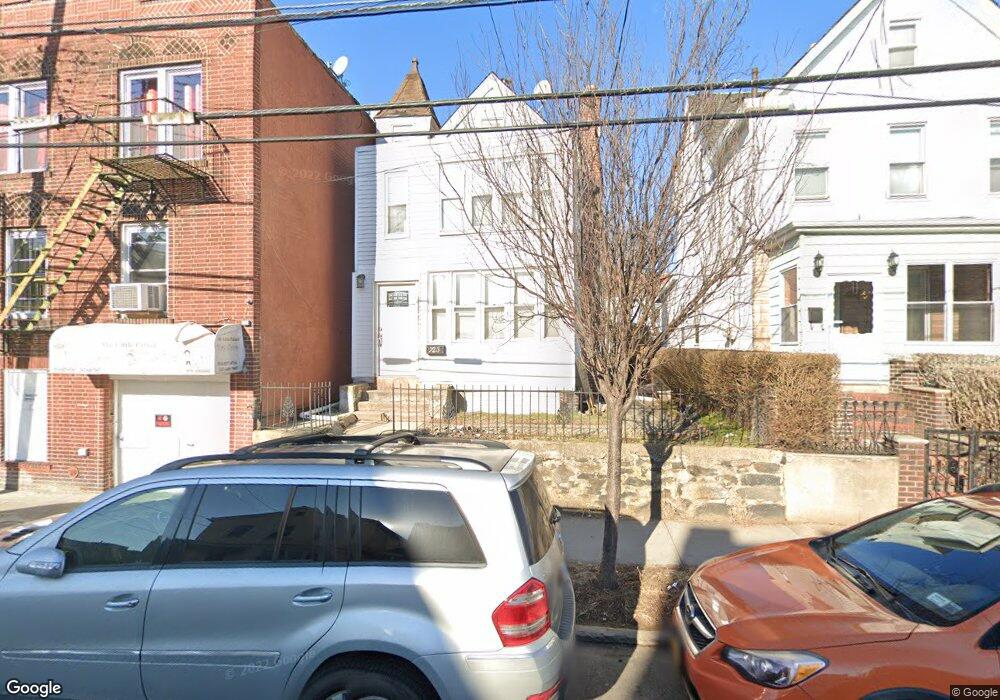
723 E 224th St Bronx, NY 10466
Wakefield NeighborhoodEstimated Value: $606,165 - $675,000
Studio
--
Bath
1,293
Sq Ft
$492/Sq Ft
Est. Value
About This Home
This home is located at 723 E 224th St, Bronx, NY 10466 and is currently estimated at $635,791, approximately $491 per square foot. 723 E 224th St is a home located in Bronx County with nearby schools including Ps 21 Philip H Sheridan, North Bronx School of Empowerment, and Girls Preparatory Charter School of the Bronx II.
Ownership History
Date
Name
Owned For
Owner Type
Purchase Details
Closed on
Sep 30, 2002
Sold by
Treuhold Capital Group
Bought by
Wigfall Kareem and Wigfall Lanay
Current Estimated Value
Home Financials for this Owner
Home Financials are based on the most recent Mortgage that was taken out on this home.
Original Mortgage
$241,214
Interest Rate
6.02%
Purchase Details
Closed on
May 7, 2002
Sold by
Brown Norris and Brown Carmen
Bought by
Treuhold Capital Group L
Purchase Details
Closed on
Mar 12, 1996
Sold by
First Home Brokerage Corp
Bought by
Brown Norris and Brown Carmen
Home Financials for this Owner
Home Financials are based on the most recent Mortgage that was taken out on this home.
Original Mortgage
$127,812
Interest Rate
7.31%
Mortgage Type
FHA
Purchase Details
Closed on
Jan 22, 1996
Sold by
Williams Rosa D
Bought by
First Home Brokerage Corp
Home Financials for this Owner
Home Financials are based on the most recent Mortgage that was taken out on this home.
Original Mortgage
$127,812
Interest Rate
7.31%
Mortgage Type
FHA
Create a Home Valuation Report for This Property
The Home Valuation Report is an in-depth analysis detailing your home's value as well as a comparison with similar homes in the area
Home Values in the Area
Average Home Value in this Area
Purchase History
| Date | Buyer | Sale Price | Title Company |
|---|---|---|---|
| Wigfall Kareem | -- | -- | |
| Treuhold Capital Group L | -- | -- | |
| Brown Norris | $133,000 | -- | |
| First Home Brokerage Corp | $70,000 | First American Title Ins Co |
Source: Public Records
Mortgage History
| Date | Status | Borrower | Loan Amount |
|---|---|---|---|
| Previous Owner | Wigfall Kareem | $241,214 | |
| Previous Owner | Brown Norris | $127,812 |
Source: Public Records
Tax History
| Year | Tax Paid | Tax Assessment Tax Assessment Total Assessment is a certain percentage of the fair market value that is determined by local assessors to be the total taxable value of land and additions on the property. | Land | Improvement |
|---|---|---|---|---|
| 2025 | $3,911 | $22,122 | $4,290 | $17,832 |
| 2024 | $3,911 | $20,870 | $4,399 | $16,471 |
| 2023 | $3,714 | $19,690 | $4,737 | $14,953 |
| 2022 | $3,421 | $28,500 | $7,260 | $21,240 |
| 2021 | $3,606 | $28,200 | $7,260 | $20,940 |
| 2020 | $3,606 | $25,740 | $7,260 | $18,480 |
| 2019 | $3,345 | $25,560 | $7,260 | $18,300 |
| 2018 | $3,047 | $16,408 | $6,531 | $9,877 |
| 2017 | $2,856 | $15,480 | $5,676 | $9,804 |
| 2016 | $2,785 | $15,480 | $5,049 | $10,431 |
| 2015 | $1,542 | $15,363 | $6,647 | $8,716 |
| 2014 | $1,542 | $14,494 | $6,939 | $7,555 |
Source: Public Records
Map
Nearby Homes
- 669 E 224th St
- 751 E 224th St Unit ALL
- 675 E 223rd St
- 753 E 224th St Unit ALL
- 732 E 223rd St
- 686 E 223rd St Unit B
- 717 E 226th St
- 642 E 223rd St
- 679 E 221st St
- 741 E 227th St
- 3980 Carpenter Ave
- 622 E 223rd St
- 819 E 223rd St
- 625 E 222nd St
- 762 E 221st St
- 838 E 226th St
- 738 E 229th St
- 804 E 221st St
- 841 E 226th St
- 831 E 221st St
- 727 E 224th St
- 721 E 224th St
- 729 E 224th St
- 733 E 224th St
- 715 E 224th St
- 731 E 224th St
- 713 E 224th St
- 720 E 225th St
- 724 E 225th St
- 728 E 225th St
- 737 E 224th St
- 739 E 224th St
- 730 E 225th St
- 724 E 224th St
- 726 E 224th St
- 722 E 224th St
- 3958-3972 White Plains Rd
- 728 E 224th St
- 741 E 224th St
- 734 E 225th St
Your Personal Tour Guide
Ask me questions while you tour the home.