Estimated Value: $125,000 - $160,440
3
Beds
2
Baths
1,144
Sq Ft
$126/Sq Ft
Est. Value
About This Home
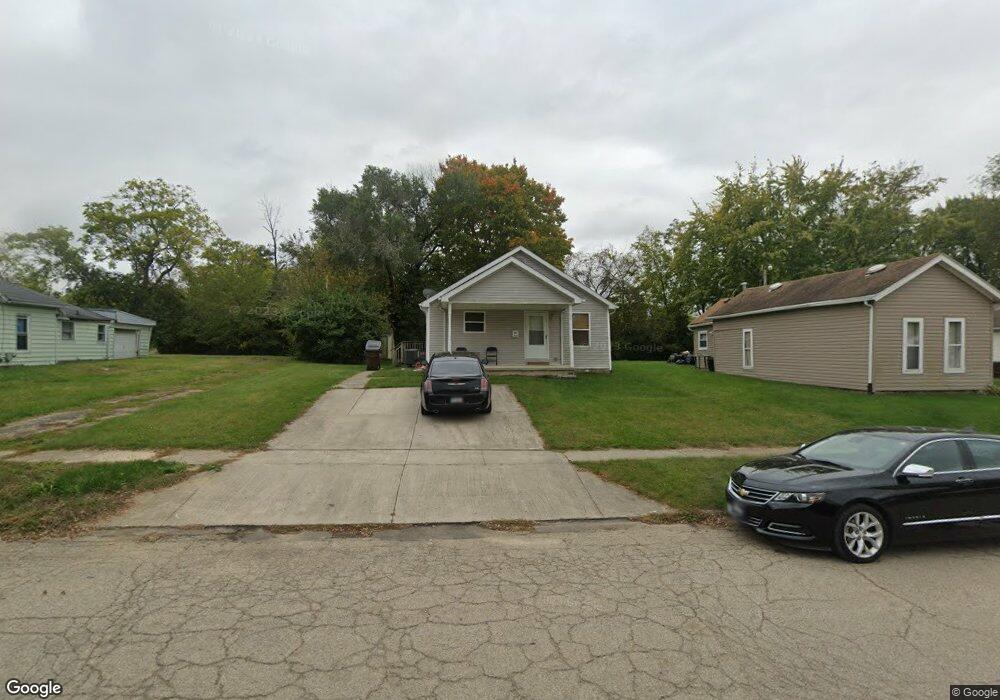
This home is located at 723 E 2nd St, Xenia, OH 45385 and is currently estimated at $144,610, approximately $126 per square foot. 723 E 2nd St is a home located in Greene County with nearby schools including Xenia High School, Summit Academy Community School for Alternative Learners - Xenia, and Legacy Christian Academy.
Ownership History
Date
Name
Owned For
Owner Type
Purchase Details
Closed on
Jul 25, 2008
Sold by
Habitat For Humanity Of Greene County
Bought by
Lane Toni
Current Estimated Value
Home Financials for this Owner
Home Financials are based on the most recent Mortgage that was taken out on this home.
Original Mortgage
$68,040
Outstanding Balance
$37,333
Interest Rate
6.36%
Mortgage Type
Seller Take Back
Estimated Equity
$107,277
Purchase Details
Closed on
Jan 19, 2007
Sold by
City Of Xenia
Bought by
Habitat For Humanity Of Greene County
Create a Home Valuation Report for This Property
The Home Valuation Report is an in-depth analysis detailing your home's value as well as a comparison with similar homes in the area
Home Values in the Area
Average Home Value in this Area
Purchase History
| Date | Buyer | Sale Price | Title Company |
|---|---|---|---|
| Lane Toni | $68,100 | Attorney | |
| Habitat For Humanity Of Greene County | -- | Attorney |
Source: Public Records
Mortgage History
| Date | Status | Borrower | Loan Amount |
|---|---|---|---|
| Open | Lane Toni | $68,040 |
Source: Public Records
Tax History
| Year | Tax Paid | Tax Assessment Tax Assessment Total Assessment is a certain percentage of the fair market value that is determined by local assessors to be the total taxable value of land and additions on the property. | Land | Improvement |
|---|---|---|---|---|
| 2025 | $1,823 | $41,870 | $2,530 | $39,340 |
| 2024 | $1,823 | $41,870 | $2,530 | $39,340 |
| 2023 | $1,792 | $41,870 | $2,530 | $39,340 |
| 2022 | $1,482 | $29,550 | $2,300 | $27,250 |
| 2021 | $1,502 | $29,550 | $2,300 | $27,250 |
| 2020 | $1,439 | $29,550 | $2,300 | $27,250 |
| 2019 | $1,393 | $26,920 | $2,410 | $24,510 |
| 2018 | $1,398 | $26,920 | $2,410 | $24,510 |
| 2017 | $1,430 | $26,920 | $2,410 | $24,510 |
| 2016 | $1,363 | $25,740 | $2,410 | $23,330 |
| 2015 | $1,366 | $25,740 | $2,410 | $23,330 |
| 2014 | $1,308 | $25,740 | $2,410 | $23,330 |
Source: Public Records
Map
Nearby Homes
Your Personal Tour Guide
Ask me questions while you tour the home.