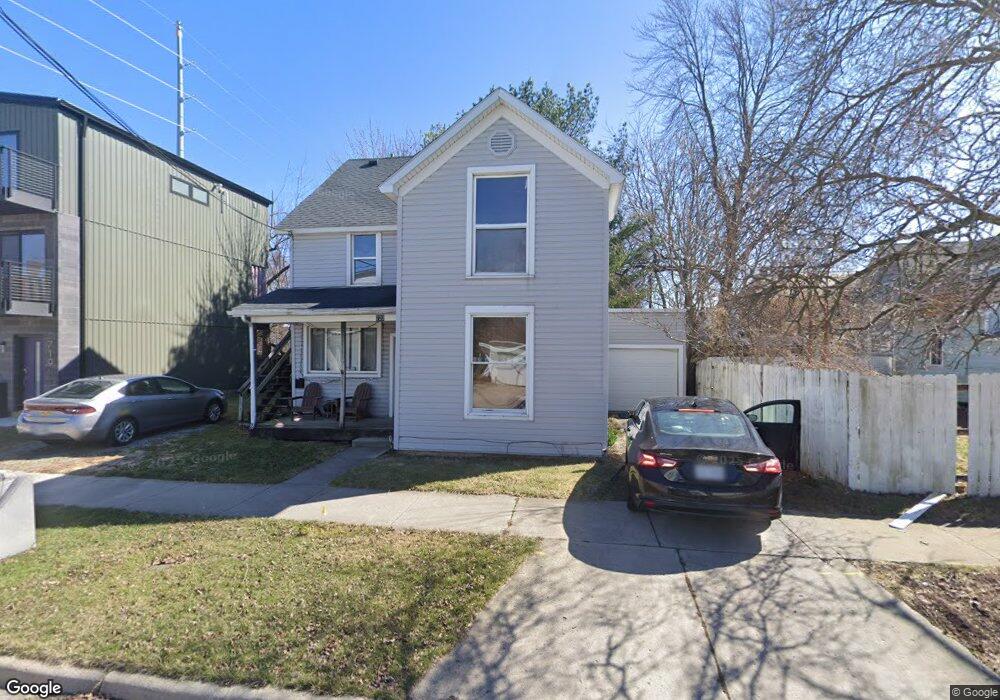
723 East St Findlay, OH 45840
Estimated Value: $134,616 - $151,000
4
Beds
2
Baths
1,749
Sq Ft
$82/Sq Ft
Est. Value
About This Home
This home is located at 723 East St, Findlay, OH 45840 and is currently estimated at $142,654, approximately $81 per square foot. 723 East St is a home located in Hancock County with nearby schools including Lincoln Elementary School, Donnell Middle School, and Findlay High School.
Ownership History
Date
Name
Owned For
Owner Type
Purchase Details
Closed on
Nov 22, 2022
Sold by
Cunningham Jamie L and Cunningham Jamie L
Bought by
Covenant Rentals Llc
Current Estimated Value
Purchase Details
Closed on
Mar 20, 1995
Sold by
Beltz Billy
Bought by
Cunningham Russell and Cunningham Jamie
Home Financials for this Owner
Home Financials are based on the most recent Mortgage that was taken out on this home.
Original Mortgage
$27,300
Interest Rate
11.75%
Mortgage Type
New Conventional
Purchase Details
Closed on
Aug 12, 1991
Bought by
Beltz Billy B and Beltz Lois A
Create a Home Valuation Report for This Property
The Home Valuation Report is an in-depth analysis detailing your home's value as well as a comparison with similar homes in the area
Home Values in the Area
Average Home Value in this Area
Purchase History
| Date | Buyer | Sale Price | Title Company |
|---|---|---|---|
| Covenant Rentals Llc | -- | -- | |
| Cunningham Russell | $39,000 | -- | |
| Beltz Billy B | -- | -- |
Source: Public Records
Mortgage History
| Date | Status | Borrower | Loan Amount |
|---|---|---|---|
| Previous Owner | Cunningham Russell | $27,300 |
Source: Public Records
Tax History Compared to Growth
Tax History
| Year | Tax Paid | Tax Assessment Tax Assessment Total Assessment is a certain percentage of the fair market value that is determined by local assessors to be the total taxable value of land and additions on the property. | Land | Improvement |
|---|---|---|---|---|
| 2024 | $1,208 | $33,130 | $3,090 | $30,040 |
| 2023 | $1,210 | $33,130 | $3,090 | $30,040 |
| 2022 | $1,205 | $33,130 | $3,090 | $30,040 |
| 2021 | $950 | $22,740 | $3,100 | $19,640 |
| 2020 | $950 | $22,740 | $3,100 | $19,640 |
| 2019 | $931 | $22,740 | $3,100 | $19,640 |
| 2018 | $885 | $19,780 | $2,700 | $17,080 |
| 2017 | $883 | $19,780 | $2,700 | $17,080 |
| 2016 | $882 | $19,780 | $2,700 | $17,080 |
| 2015 | $707 | $15,710 | $2,490 | $13,220 |
| 2014 | $707 | $15,710 | $2,490 | $13,220 |
| 2012 | $848 | $18,660 | $2,490 | $16,170 |
Source: Public Records
Map
Nearby Homes