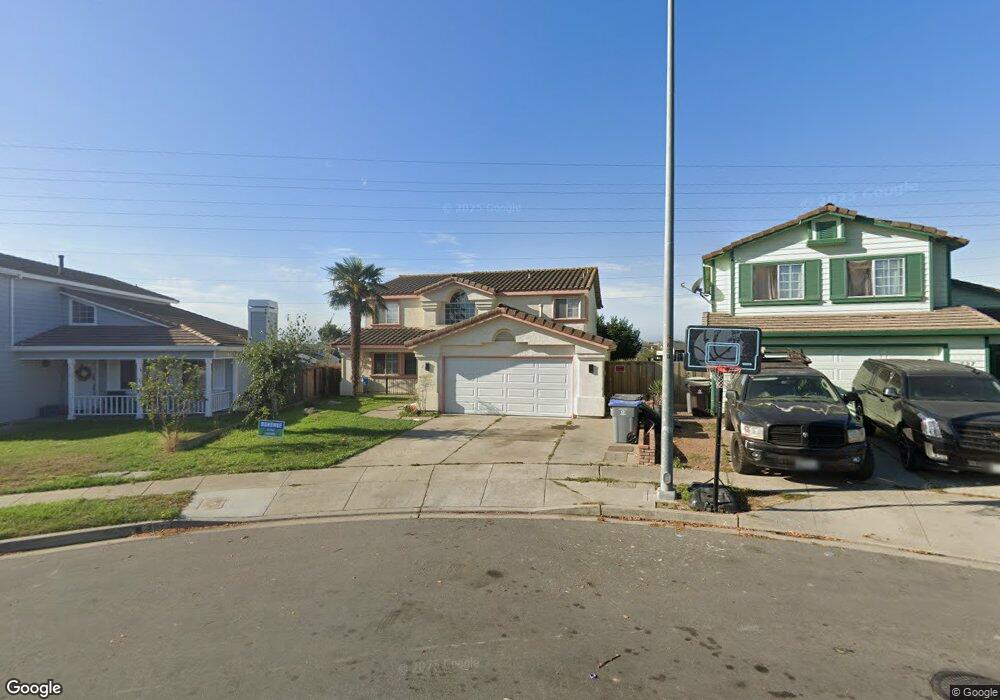
723 Geneva Way Salinas, CA 93907
Boronda NeighborhoodEstimated Value: $886,000 - $972,000
About This Home
This home is located at 723 Geneva Way, Salinas, CA 93907 and is currently estimated at $925,510, approximately $336 per square foot. 723 Geneva Way is a home located in Monterey County with nearby schools including Laurel Wood Elementary School, Roosevelt Elementary School, and Washington Middle School.
Ownership History
We collect this data history from publicly available records. To have your information removed, we recommend requesting removal directly through your county’s website.
Purchase Details
Home Financials for this Owner
Home Financials are based on the most recent Mortgage that was taken out on this home.Home Values in the Area
Average Home Value in this Area
Purchase History
We collect this data history from publicly available records. To have your information removed, we recommend requesting removal directly through your county’s website.
| Date | Buyer | Sale Price | Title Company |
|---|---|---|---|
| $468,000 | Stewart Title |
Mortgage History
We collect this data history from publicly available records. To have your information removed, we recommend requesting removal directly through your county’s website.
| Date | Status | Borrower | Loan Amount |
|---|---|---|---|
| Open | $374,400 | ||
| Closed | $70,200 |
Tax History
We collect this data history from publicly available records. To have your information removed, we recommend requesting removal directly through your county’s website.
| Year | Tax Paid | Tax Assessment Tax Assessment Total Assessment is a certain percentage of the fair market value that is determined by local assessors to be the total taxable value of land and additions on the property. | Land | Improvement |
|---|---|---|---|---|
| 2025 | $7,767 | $677,803 | $275,174 | $402,629 |
| 2024 | $7,767 | $664,514 | $269,779 | $394,735 |
| 2023 | $7,506 | $651,486 | $264,490 | $386,996 |
| 2022 | $7,227 | $638,712 | $259,304 | $379,408 |
| 2021 | $6,763 | $610,000 | $248,000 | $362,000 |
| 2020 | $6,018 | $552,000 | $224,000 | $328,000 |
| 2019 | $6,466 | $586,000 | $238,000 | $348,000 |
| 2018 | $6,082 | $547,000 | $222,000 | $325,000 |
| 2017 | $6,456 | $569,000 | $231,000 | $338,000 |
| 2016 | $5,992 | $517,000 | $210,000 | $307,000 |
| 2015 | $5,700 | $480,000 | $195,000 | $285,000 |
| 2014 | $4,224 | $373,000 | $151,000 | $222,000 |
Map
- 350 Victor St
- 247 Arguello Dr
- 505 Polk Cir
- 203 Sansome St
- 746 Nacional Ct
- 89 Clark St
- 23 Capitol St
- 230 Martella St
- 640 Park St
- 13 E Lake St
- 606 Central Ave
- 612 Central Ave
- 1350 Cherokee Dr
- 344 Pueblo Dr
- 311 Amherst Dr
- 333 West St
- 24 Saint Francis Way
- 767 Lemos Ave
- 782 Fairfax Dr
- 325 San Vincente Ave
- 712 Geneva Way
- 708 Geneva Way
- 716 Geneva Way
- 729 Potrero Way
- 735 Potrero Way
- 704 Geneva Way
- 721 Potrero Way
- 734 Geneva Way
- 739 Potrero Way
- 713 Potrero Way
- 738 Geneva Way
- 709 Potrero Way
- 713 Geneva Way
- 745 Potrero Way
- 735 Victor St
- 705 Geneva Way
- 717 Geneva Way
- 745 Victor St
- 719 Geneva Way
- 732 Potrero Way
Ask me questions while you tour the home.