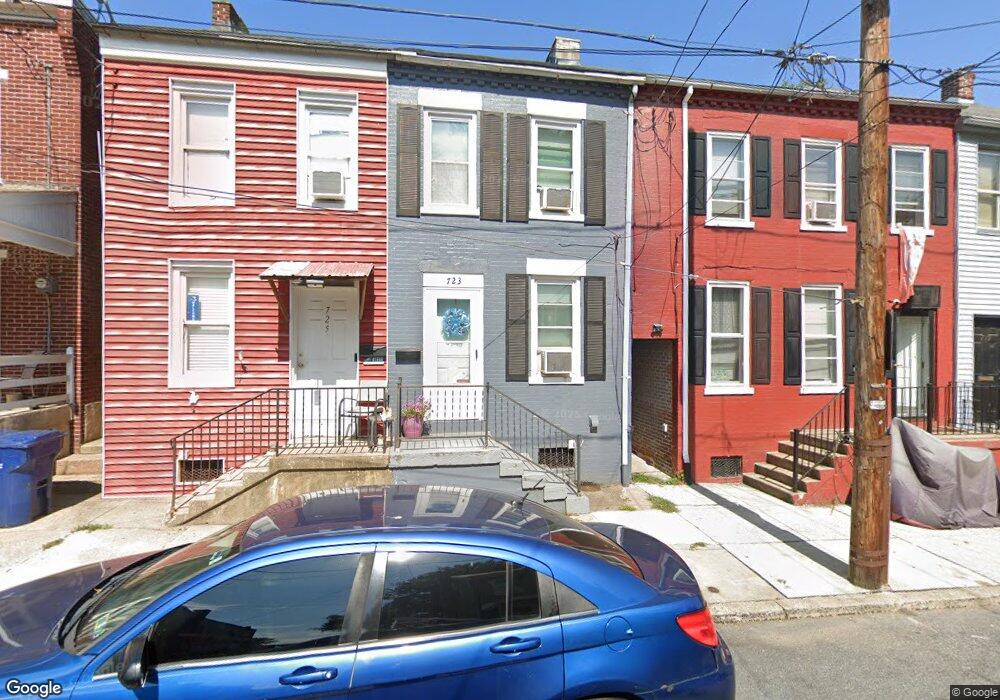
723 High St Lancaster, PA 17603
Cabbage Hill NeighborhoodEstimated Value: $170,000 - $195,000
3
Beds
1
Bath
1,117
Sq Ft
$164/Sq Ft
Est. Value
About This Home
This home is located at 723 High St, Lancaster, PA 17603 and is currently estimated at $182,694, approximately $163 per square foot. 723 High St is a home located in Lancaster County with nearby schools including Lafayette Elementary School, Wheatland Middle School, and McCaskey High School.
Ownership History
Date
Name
Owned For
Owner Type
Purchase Details
Closed on
Jun 22, 2005
Sold by
Applegarth Jean Suzanne
Bought by
Winters Clayton G and Winters Deborah K
Current Estimated Value
Home Financials for this Owner
Home Financials are based on the most recent Mortgage that was taken out on this home.
Original Mortgage
$40,500
Outstanding Balance
$21,225
Interest Rate
5.82%
Mortgage Type
Fannie Mae Freddie Mac
Estimated Equity
$161,469
Purchase Details
Closed on
May 24, 2000
Sold by
Associates Consumer Discount Company
Bought by
Applegarth Jean Suzanne
Purchase Details
Closed on
Jan 20, 2000
Sold by
Singer Susan D
Bought by
Associates Consumer Discount Company
Create a Home Valuation Report for This Property
The Home Valuation Report is an in-depth analysis detailing your home's value as well as a comparison with similar homes in the area
Home Values in the Area
Average Home Value in this Area
Purchase History
| Date | Buyer | Sale Price | Title Company |
|---|---|---|---|
| Winters Clayton G | $45,000 | -- | |
| Applegarth Jean Suzanne | $22,000 | -- | |
| Associates Consumer Discount Company | -- | -- |
Source: Public Records
Mortgage History
| Date | Status | Borrower | Loan Amount |
|---|---|---|---|
| Open | Winters Clayton G | $40,500 |
Source: Public Records
Tax History
| Year | Tax Paid | Tax Assessment Tax Assessment Total Assessment is a certain percentage of the fair market value that is determined by local assessors to be the total taxable value of land and additions on the property. | Land | Improvement |
|---|---|---|---|---|
| 2025 | $2,129 | $53,800 | $14,400 | $39,400 |
| 2024 | $2,129 | $53,800 | $14,400 | $39,400 |
| 2023 | $2,093 | $53,800 | $14,400 | $39,400 |
| 2022 | $2,006 | $53,800 | $14,400 | $39,400 |
| 2021 | $1,963 | $53,800 | $14,400 | $39,400 |
| 2020 | $1,963 | $53,800 | $14,400 | $39,400 |
| 2019 | $1,933 | $53,800 | $14,400 | $39,400 |
| 2018 | $1,147 | $53,800 | $14,400 | $39,400 |
| 2017 | $2,508 | $54,600 | $13,600 | $41,000 |
| 2016 | $2,485 | $54,600 | $13,600 | $41,000 |
| 2015 | $969 | $54,600 | $13,600 | $41,000 |
| 2014 | $2,169 | $54,600 | $13,600 | $41,000 |
Source: Public Records
Map
Nearby Homes
Your Personal Tour Guide
Ask me questions while you tour the home.