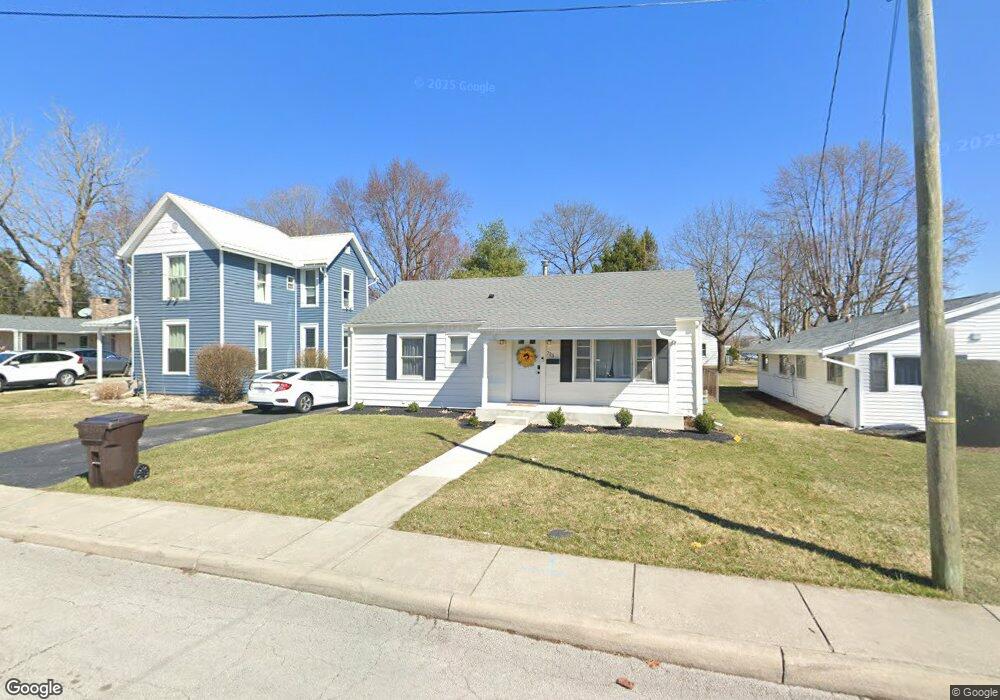
723 Morse St Findlay, OH 45840
Estimated Value: $148,555 - $155,000
2
Beds
1
Bath
1,068
Sq Ft
$142/Sq Ft
Est. Value
About This Home
This home is located at 723 Morse St, Findlay, OH 45840 and is currently estimated at $151,389, approximately $141 per square foot. 723 Morse St is a home located in Hancock County with nearby schools including Whittier Elementary School, Wilson Vance Elementary School, and Donnell Middle School.
Ownership History
Date
Name
Owned For
Owner Type
Purchase Details
Closed on
Mar 31, 2023
Sold by
Bosserman Lindsay
Bought by
Baldridge Caleb A
Current Estimated Value
Home Financials for this Owner
Home Financials are based on the most recent Mortgage that was taken out on this home.
Original Mortgage
$124,160
Outstanding Balance
$120,529
Interest Rate
6.32%
Mortgage Type
New Conventional
Estimated Equity
$30,860
Purchase Details
Closed on
Sep 7, 2007
Sold by
Smith Todd J and Smith Leslie A
Bought by
Bosserman Lindsay
Home Financials for this Owner
Home Financials are based on the most recent Mortgage that was taken out on this home.
Original Mortgage
$69,700
Interest Rate
6.72%
Mortgage Type
Purchase Money Mortgage
Purchase Details
Closed on
May 3, 2002
Sold by
Holmes Melissa L
Bought by
Smith Todd J
Home Financials for this Owner
Home Financials are based on the most recent Mortgage that was taken out on this home.
Original Mortgage
$71,500
Interest Rate
7.18%
Mortgage Type
New Conventional
Purchase Details
Closed on
Sep 7, 1999
Sold by
Opperman Ronald
Bought by
Holmes Melissa
Home Financials for this Owner
Home Financials are based on the most recent Mortgage that was taken out on this home.
Original Mortgage
$74,000
Interest Rate
7.59%
Mortgage Type
New Conventional
Purchase Details
Closed on
Sep 17, 1985
Bought by
Opperman Ronald J and Opperman Beth M
Purchase Details
Closed on
Mar 24, 1983
Bought by
Dennis Alyce M
Create a Home Valuation Report for This Property
The Home Valuation Report is an in-depth analysis detailing your home's value as well as a comparison with similar homes in the area
Home Values in the Area
Average Home Value in this Area
Purchase History
| Date | Buyer | Sale Price | Title Company |
|---|---|---|---|
| Baldridge Caleb A | -- | -- | |
| Bosserman Lindsay | $82,000 | Hancock Title Agency | |
| Smith Todd J | $71,500 | -- | |
| Holmes Melissa | $55,500 | -- | |
| Opperman Ronald J | $40,000 | -- | |
| Dennis Alyce M | $36,500 | -- |
Source: Public Records
Mortgage History
| Date | Status | Borrower | Loan Amount |
|---|---|---|---|
| Open | Baldridge Caleb A | $124,160 | |
| Previous Owner | Bosserman Lindsay | $69,700 | |
| Previous Owner | Smith Todd J | $71,500 | |
| Previous Owner | Holmes Melissa | $74,000 |
Source: Public Records
Tax History
| Year | Tax Paid | Tax Assessment Tax Assessment Total Assessment is a certain percentage of the fair market value that is determined by local assessors to be the total taxable value of land and additions on the property. | Land | Improvement |
|---|---|---|---|---|
| 2024 | $1,420 | $39,970 | $4,620 | $35,350 |
| 2023 | $1,422 | $39,970 | $4,620 | $35,350 |
| 2022 | $1,417 | $39,970 | $4,620 | $35,350 |
| 2021 | $1,180 | $28,990 | $4,620 | $24,370 |
| 2020 | $1,180 | $28,990 | $4,620 | $24,370 |
| 2019 | $1,156 | $28,990 | $4,620 | $24,370 |
| 2018 | $1,009 | $23,180 | $4,200 | $18,980 |
| 2017 | $504 | $23,180 | $4,200 | $18,980 |
| 2016 | $1,003 | $23,180 | $4,200 | $18,980 |
| 2015 | $1,057 | $24,180 | $4,200 | $19,980 |
| 2014 | $1,057 | $24,180 | $4,200 | $19,980 |
| 2012 | $1,051 | $23,800 | $4,200 | $19,600 |
Source: Public Records
Map
Nearby Homes
- 623 E Sandusky St
- 15591 Canadian Way
- 15586 Canadian Way
- 15615 Canadian Way
- 1001 Decker Ave
- 829 Maple Ave
- 1037 Fishlock Ave
- 309 Huron Rd
- 1105 1st St
- 216 1st St
- 655 Clinton Ct
- 313 2nd St
- 865 S Main St
- 1100 Stall Dr
- 731 5th St
- 523 Center St
- 1421 E Sandusky St
- 640 Center St
- 100 Warrington Ave
- 1421 Autumn Dr
Your Personal Tour Guide
Ask me questions while you tour the home.