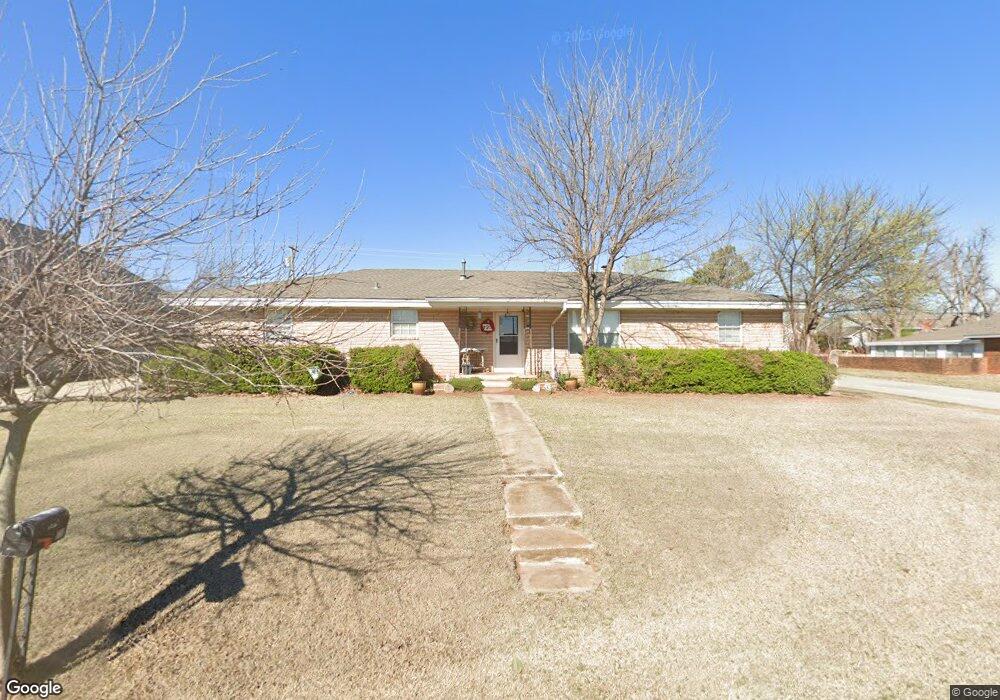
723 N Jackson Ave Blanchard, OK 73010
Estimated Value: $245,000 - $288,238
3
Beds
2
Baths
2,161
Sq Ft
$125/Sq Ft
Est. Value
About This Home
This home is located at 723 N Jackson Ave, Blanchard, OK 73010 and is currently estimated at $269,560, approximately $124 per square foot. 723 N Jackson Ave is a home located in McClain County with nearby schools including Blanchard Elementary School, Blanchard Intermediate School, and Blanchard Middle School.
Ownership History
Date
Name
Owned For
Owner Type
Purchase Details
Closed on
May 3, 2012
Sold by
Rogers Gloria J
Bought by
Kimbrell Ricky L and Kimbrell Ellen K
Current Estimated Value
Home Financials for this Owner
Home Financials are based on the most recent Mortgage that was taken out on this home.
Original Mortgage
$125,967
Outstanding Balance
$87,823
Interest Rate
4.11%
Mortgage Type
FHA
Estimated Equity
$181,737
Purchase Details
Closed on
May 15, 2011
Sold by
Milburn Property L L C
Bought by
Kimbrell Ricky L and Kimbrell Ellen K
Purchase Details
Closed on
Oct 5, 2006
Sold by
Richey Paul Leon and Richey Jo Ann
Bought by
Rogers Jerry J and Rogers Gloria J
Home Financials for this Owner
Home Financials are based on the most recent Mortgage that was taken out on this home.
Original Mortgage
$120,000
Interest Rate
5.06%
Mortgage Type
Purchase Money Mortgage
Purchase Details
Closed on
Sep 30, 1996
Sold by
Goss Velma and Goss Charles
Bought by
Richey Jo Ann and Richey Paul
Create a Home Valuation Report for This Property
The Home Valuation Report is an in-depth analysis detailing your home's value as well as a comparison with similar homes in the area
Home Values in the Area
Average Home Value in this Area
Purchase History
| Date | Buyer | Sale Price | Title Company |
|---|---|---|---|
| Kimbrell Ricky L | $129,000 | None Available | |
| Kimbrell Ricky L | $32,000 | First American Title & Trust | |
| Rogers Jerry J | -- | None Available | |
| Richey Jo Ann | $73,000 | -- |
Source: Public Records
Mortgage History
| Date | Status | Borrower | Loan Amount |
|---|---|---|---|
| Open | Kimbrell Ricky L | $125,967 | |
| Previous Owner | Rogers Jerry J | $120,000 |
Source: Public Records
Tax History Compared to Growth
Tax History
| Year | Tax Paid | Tax Assessment Tax Assessment Total Assessment is a certain percentage of the fair market value that is determined by local assessors to be the total taxable value of land and additions on the property. | Land | Improvement |
|---|---|---|---|---|
| 2025 | $2,050 | $19,499 | $2,290 | $17,209 |
| 2024 | $2,050 | $18,931 | $2,223 | $16,708 |
| 2023 | $2,050 | $18,381 | $2,019 | $16,362 |
| 2022 | $1,929 | $17,845 | $1,793 | $16,052 |
| 2021 | $1,871 | $17,326 | $1,518 | $15,808 |
| 2020 | $2,060 | $16,821 | $1,445 | $15,376 |
| 2019 | $2,033 | $16,331 | $1,375 | $14,956 |
| 2018 | $1,794 | $15,855 | $1,313 | $14,542 |
| 2017 | $1,897 | $15,393 | $1,384 | $14,009 |
| 2016 | $1,718 | $14,946 | $1,371 | $13,575 |
| 2015 | $1,702 | $14,510 | $1,217 | $13,293 |
| 2014 | $1,690 | $14,088 | $1,218 | $12,870 |
Source: Public Records
Map
Nearby Homes
- 711 N Van Buren Ave
- 911 N Jackson Ave
- 721 N Harrison Ave
- 1133 Wild Rye Ct
- 1403 Pecan Dr
- 1621 Silver Oak Dr
- 1692 Appaloosa Dr
- 945 Fox Run Ln
- 1850 Olivia Ct
- 300 Bailey St
- 416 S Harrison Ave
- 448 Highgrove Dr
- 255 Megan Ct
- 254 Megan Ct
- 1832 Buckskin Ct
- 2435 Heather Rd
- 26964 Bridlewood Rd
- 2116 Emily Rae Ln
- 694 Isabella Dr
- 23801 Oklahoma 76
- 705 N Jackson Ave
- 722 N Main
- 703 N Jackson Ave
- 801 N Jackson Ave
- 213 NE 8th St
- 710 N Main Ave
- 706 N Jackson Ave
- 802 N Jackson Ave
- 203 NE 7th St
- 812 N Main
- 804 N Jackson Ave
- 621 N Jackson Ave
- 723 N Van Buren Ave
- 806 N Jackson Ave
- 619 N Jackson Ave
- 807 N Jackson Ave
- 723 N Main
- 801 N Van Buren Ave
- 701 N Van Buren Ave
- 711 N Main