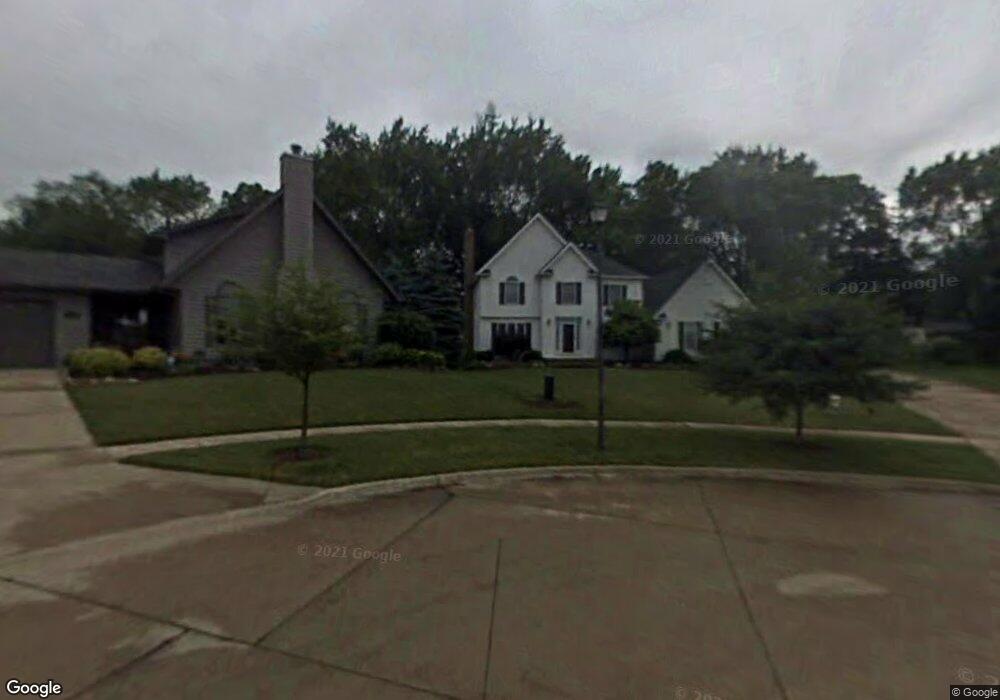
723 Olde Orchard Dr Tallmadge, OH 44278
Estimated Value: $411,833 - $470,000
4
Beds
3
Baths
2,134
Sq Ft
$206/Sq Ft
Est. Value
About This Home
This home is located at 723 Olde Orchard Dr, Tallmadge, OH 44278 and is currently estimated at $439,958, approximately $206 per square foot. 723 Olde Orchard Dr is a home located in Summit County with nearby schools including Tallmadge Middle School, Tallmadge High School, and Cornerstone Community School.
Ownership History
Date
Name
Owned For
Owner Type
Purchase Details
Closed on
Apr 26, 2016
Sold by
Spillan Scott D and Spillan Rebecca A
Bought by
Gurley Scott R and Gurley Debra
Current Estimated Value
Home Financials for this Owner
Home Financials are based on the most recent Mortgage that was taken out on this home.
Original Mortgage
$228,000
Outstanding Balance
$181,917
Interest Rate
3.73%
Mortgage Type
New Conventional
Estimated Equity
$258,041
Purchase Details
Closed on
Dec 17, 2010
Sold by
Cousins Brad and Cousins Roxanne
Bought by
Spillan Scott D and Spillan Rebecca A
Home Financials for this Owner
Home Financials are based on the most recent Mortgage that was taken out on this home.
Original Mortgage
$193,500
Interest Rate
4.22%
Mortgage Type
New Conventional
Purchase Details
Closed on
Jul 1, 2008
Sold by
Cincione Patti A and Cincione Patti Ann
Bought by
Cousins Brad and Cousins Roxanne
Home Financials for this Owner
Home Financials are based on the most recent Mortgage that was taken out on this home.
Original Mortgage
$188,485
Interest Rate
6.05%
Mortgage Type
FHA
Purchase Details
Closed on
Jan 29, 1999
Sold by
Gagne Patti A and Gagne Patti Ann
Bought by
Cincione Patti Ann
Create a Home Valuation Report for This Property
The Home Valuation Report is an in-depth analysis detailing your home's value as well as a comparison with similar homes in the area
Home Values in the Area
Average Home Value in this Area
Purchase History
| Date | Buyer | Sale Price | Title Company |
|---|---|---|---|
| Gurley Scott R | $240,000 | Kingdom Title | |
| Spillan Scott D | $215,000 | Rts Group Inc | |
| Cousins Brad | $190,000 | None Available | |
| Cincione Patti Ann | -- | -- |
Source: Public Records
Mortgage History
| Date | Status | Borrower | Loan Amount |
|---|---|---|---|
| Open | Gurley Scott R | $228,000 | |
| Previous Owner | Spillan Scott D | $193,500 | |
| Previous Owner | Cousins Brad | $188,485 |
Source: Public Records
Tax History Compared to Growth
Tax History
| Year | Tax Paid | Tax Assessment Tax Assessment Total Assessment is a certain percentage of the fair market value that is determined by local assessors to be the total taxable value of land and additions on the property. | Land | Improvement |
|---|---|---|---|---|
| 2025 | $5,971 | $118,472 | $20,507 | $97,965 |
| 2024 | $5,971 | $118,472 | $20,507 | $97,965 |
| 2023 | $5,971 | $118,472 | $20,507 | $97,965 |
| 2022 | $4,945 | $80,024 | $15,078 | $64,946 |
| 2021 | $4,753 | $76,549 | $15,078 | $61,471 |
| 2020 | $4,716 | $76,550 | $15,080 | $61,470 |
| 2019 | $5,160 | $74,970 | $14,340 | $60,630 |
| 2018 | $4,553 | $74,970 | $14,340 | $60,630 |
| 2017 | $3,917 | $74,970 | $14,340 | $60,630 |
| 2016 | $4,221 | $63,800 | $14,340 | $49,460 |
| 2015 | $3,917 | $63,800 | $14,340 | $49,460 |
| 2014 | $3,891 | $63,800 | $14,340 | $49,460 |
| 2013 | $3,960 | $66,140 | $14,340 | $51,800 |
Source: Public Records
Map
Nearby Homes
- 810 Norton Dr
- 288 S Munroe Rd
- 821 Olde Orchard Dr
- 243 S Munroe Rd
- 523 S Munroe Rd
- 549 S Munroe Rd
- 206 Fawnwood Dr
- 786 Southeast Ave
- 213 Green Hill Dr
- 988 Beechwood Dr
- 1034 Southeast Ave
- 185 Reserve Dr
- 0 East Ave
- 1075 Amy Trail
- 750 Danner Rd
- 330 Hanna Dr
- 1029 Maple St
- 353 Southeast Ave
- 313 Southeast Ave
- 758 Humble Rd
- 719 Olde Orchard Dr
- 733 Olde Orchard Dr
- 720 Norton Dr
- 710 Norton Dr
- 373 S Munroe Rd
- 730 Norton Dr
- 743 Olde Orchard Dr
- 722 Olde Orchard Dr
- 383 S Munroe Rd
- 363 S Munroe Rd
- 728 Olde Orchard Dr
- 738 Olde Orchard Dr
- 740 Norton Dr
- 753 Olde Orchard Dr
- 750 Olde Orchard Dr
- 391 S Munroe Rd
- 750 Norton Dr
- 751 Jennifer Trail
- 763 Olde Orchard Dr
- 762 Olde Orchard Dr