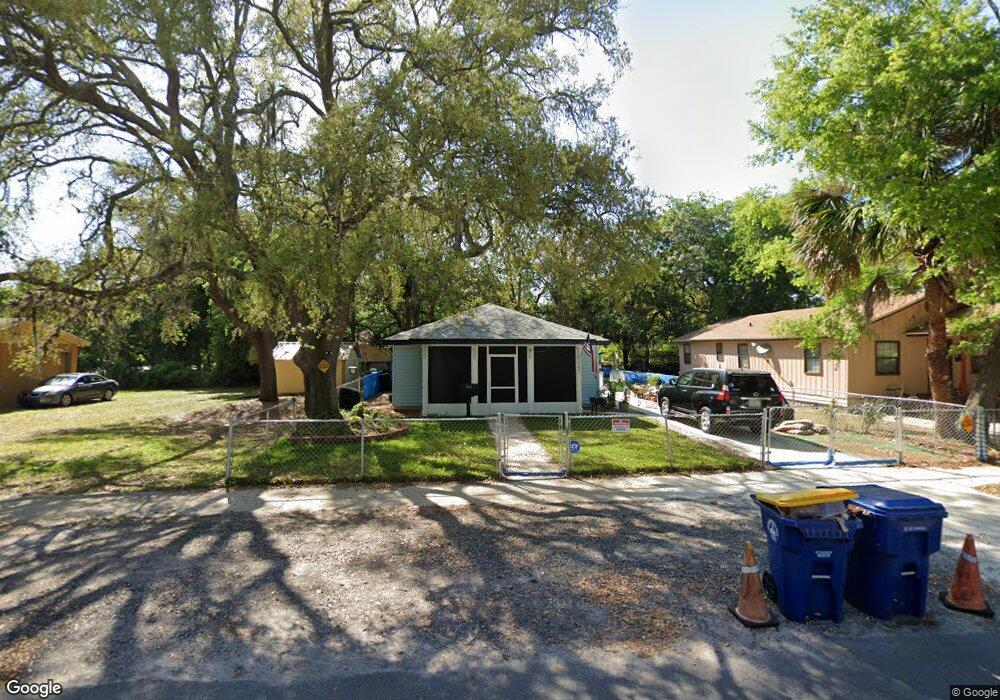
723 S 11th St Fernandina Beach, FL 32034
Estimated Value: $347,000 - $418,000
3
Beds
2
Baths
1,050
Sq Ft
$353/Sq Ft
Est. Value
About This Home
This home is located at 723 S 11th St, Fernandina Beach, FL 32034 and is currently estimated at $370,533, approximately $352 per square foot. 723 S 11th St is a home located in Nassau County with nearby schools including Southside Elementary School, Emma Love Hardee Elementary School, and Fernandina Beach Middle School.
Ownership History
Date
Name
Owned For
Owner Type
Purchase Details
Closed on
Oct 31, 2003
Sold by
Nassau Habitat For Humanity Inc
Bought by
Marsella Sheryl N
Current Estimated Value
Home Financials for this Owner
Home Financials are based on the most recent Mortgage that was taken out on this home.
Original Mortgage
$47,096
Outstanding Balance
$21,454
Interest Rate
5.75%
Mortgage Type
Seller Take Back
Estimated Equity
$349,079
Purchase Details
Closed on
Aug 9, 1999
Sold by
Burns Paul C and Paul C Burns Living Trust
Bought by
Nassau Habitat For Humanity Inc
Create a Home Valuation Report for This Property
The Home Valuation Report is an in-depth analysis detailing your home's value as well as a comparison with similar homes in the area
Home Values in the Area
Average Home Value in this Area
Purchase History
| Date | Buyer | Sale Price | Title Company |
|---|---|---|---|
| Marsella Sheryl N | $47,600 | -- | |
| Nassau Habitat For Humanity Inc | $2,000 | -- |
Source: Public Records
Mortgage History
| Date | Status | Borrower | Loan Amount |
|---|---|---|---|
| Open | Marsella Sheryl N | $47,096 |
Source: Public Records
Tax History Compared to Growth
Tax History
| Year | Tax Paid | Tax Assessment Tax Assessment Total Assessment is a certain percentage of the fair market value that is determined by local assessors to be the total taxable value of land and additions on the property. | Land | Improvement |
|---|---|---|---|---|
| 2024 | $576 | $68,454 | -- | -- |
| 2023 | $576 | $66,460 | $0 | $0 |
| 2022 | $539 | $64,524 | $0 | $0 |
| 2021 | $550 | $62,645 | $0 | $0 |
| 2020 | $558 | $61,780 | $0 | $0 |
| 2019 | $579 | $60,391 | $0 | $0 |
| 2018 | $567 | $59,265 | $0 | $0 |
| 2017 | $551 | $58,046 | $0 | $0 |
| 2016 | $553 | $56,852 | $0 | $0 |
| 2015 | $559 | $56,457 | $0 | $0 |
| 2014 | $560 | $56,009 | $0 | $0 |
Source: Public Records
Map
Nearby Homes