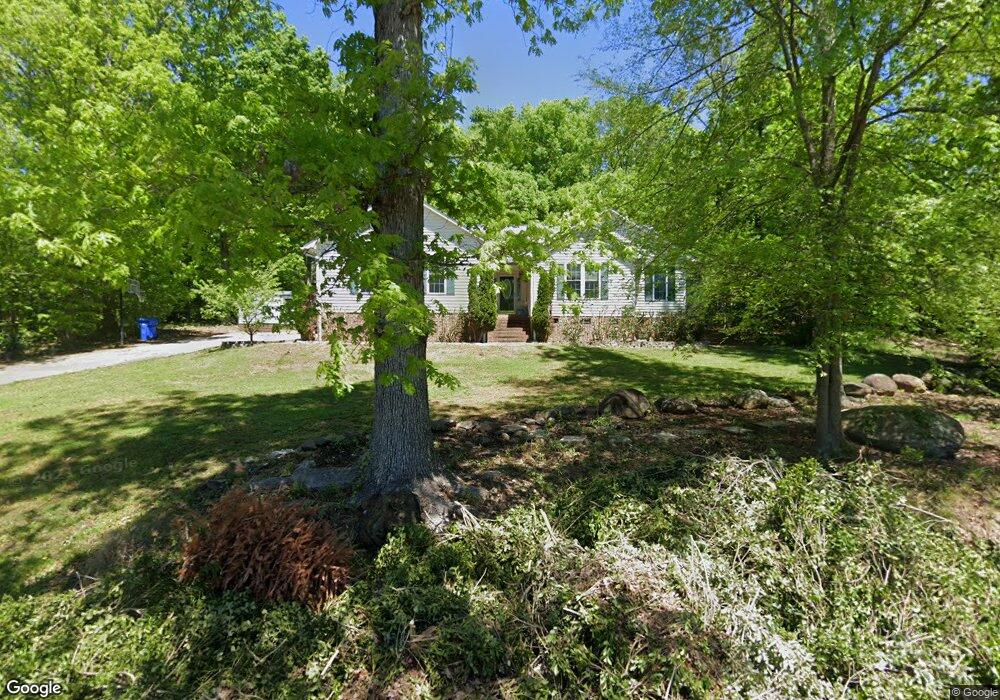
723 Shady Dr Unit 53-57 Albemarle, NC 28001
Estimated Value: $274,147 - $350,000
3
Beds
2
Baths
1,580
Sq Ft
$195/Sq Ft
Est. Value
About This Home
This home is located at 723 Shady Dr Unit 53-57, Albemarle, NC 28001 and is currently estimated at $308,287, approximately $195 per square foot. 723 Shady Dr Unit 53-57 is a home located in Stanly County with nearby schools including Central Elementary School, Albemarle Middle School, and Albemarle High School.
Ownership History
Date
Name
Owned For
Owner Type
Purchase Details
Closed on
Jun 10, 2016
Sold by
Peckham Chad T and Peckham Katie L
Bought by
Daugherty Daphne J
Current Estimated Value
Purchase Details
Closed on
Jan 1, 2012
Bought by
Peckham Chad T and Peckham Katie L
Purchase Details
Closed on
Mar 28, 2011
Sold by
Efird Mark and Efird Susan Thompson Hatley
Bought by
Peckham Chard T and Peckham Katie L
Home Financials for this Owner
Home Financials are based on the most recent Mortgage that was taken out on this home.
Original Mortgage
$146,500
Interest Rate
4.95%
Mortgage Type
New Conventional
Purchase Details
Closed on
Mar 1, 2011
Sold by
Efird Susan H and Hatley Susan T
Bought by
Efird Mark
Home Financials for this Owner
Home Financials are based on the most recent Mortgage that was taken out on this home.
Original Mortgage
$146,500
Interest Rate
4.95%
Mortgage Type
New Conventional
Create a Home Valuation Report for This Property
The Home Valuation Report is an in-depth analysis detailing your home's value as well as a comparison with similar homes in the area
Home Values in the Area
Average Home Value in this Area
Purchase History
| Date | Buyer | Sale Price | Title Company |
|---|---|---|---|
| Daugherty Daphne J | $157,000 | Attorney | |
| Peckham Chad T | -- | -- | |
| Peckham Chard T | $154,500 | None Available | |
| Efird Mark | -- | None Available |
Source: Public Records
Mortgage History
| Date | Status | Borrower | Loan Amount |
|---|---|---|---|
| Previous Owner | Peckham Chard T | $146,500 |
Source: Public Records
Tax History Compared to Growth
Tax History
| Year | Tax Paid | Tax Assessment Tax Assessment Total Assessment is a certain percentage of the fair market value that is determined by local assessors to be the total taxable value of land and additions on the property. | Land | Improvement |
|---|---|---|---|---|
| 2025 | $2,330 | $208,028 | $24,350 | $183,678 |
| 2024 | $1,966 | $161,122 | $13,486 | $147,636 |
| 2023 | $1,966 | $161,122 | $13,486 | $147,636 |
| 2022 | $1,966 | $161,122 | $13,486 | $147,636 |
| 2021 | $1,966 | $161,122 | $13,486 | $147,636 |
| 2020 | $1,920 | $148,075 | $11,988 | $136,087 |
| 2019 | $1,940 | $148,075 | $11,988 | $136,087 |
| 2018 | $1,940 | $148,075 | $11,988 | $136,087 |
| 2017 | $1,866 | $148,075 | $11,988 | $136,087 |
| 2016 | $1,638 | $129,961 | $11,988 | $117,973 |
| 2015 | $1,654 | $129,961 | $11,988 | $117,973 |
| 2014 | $1,525 | $129,961 | $11,988 | $117,973 |
Source: Public Records
Map
Nearby Homes
- 714 Shady Dr
- 1713 Wildwood Dr
- 751 Mockingbird Rd Unit 1
- 753 Mockingbird Rd Unit 2
- 755 Mockingbird Rd Unit 3
- 757 Mockingbird Rd Unit 4
- 759 Mockingbird Rd Unit 5
- 417 Park Ridge Rd
- 604 Muirfield Dr
- 603 Turnberry Ct
- 390 Park Rd
- 1811 Continental Dr
- 1405 Northcrest Dr
- 906 Colonial Dr
- 1202 Pineview Dr
- 217 Circle Dr
- 711 Yadkin St
- 901 Ridge St
- 1325 Lee Lynn Dr Unit 7
- 805 East St
- 723 Shady Dr
- 1600A Wildwood Dr
- 1602 Wildwood Dr
- 1600B Wildwood Dr
- 717 Shady Dr
- 1722 Wildwood Dr
- 000 Shady Dr Unit 58-61
- 707 Shady Dr Unit 1
- 707 Shady Dr Unit 2
- 724 Shady Dr
- 720 Shady Dr
- 1714 Wildwood Dr
- 730 Shady Dr
- 715 Shady Dr
- 1730 Wildwood Dr
- VAC Wildwood Dr
- 1601 Wildwood Dr
- 1603 Wildwood Dr
- 713 Mockingbird Rd
- 1711 Wildwood Dr