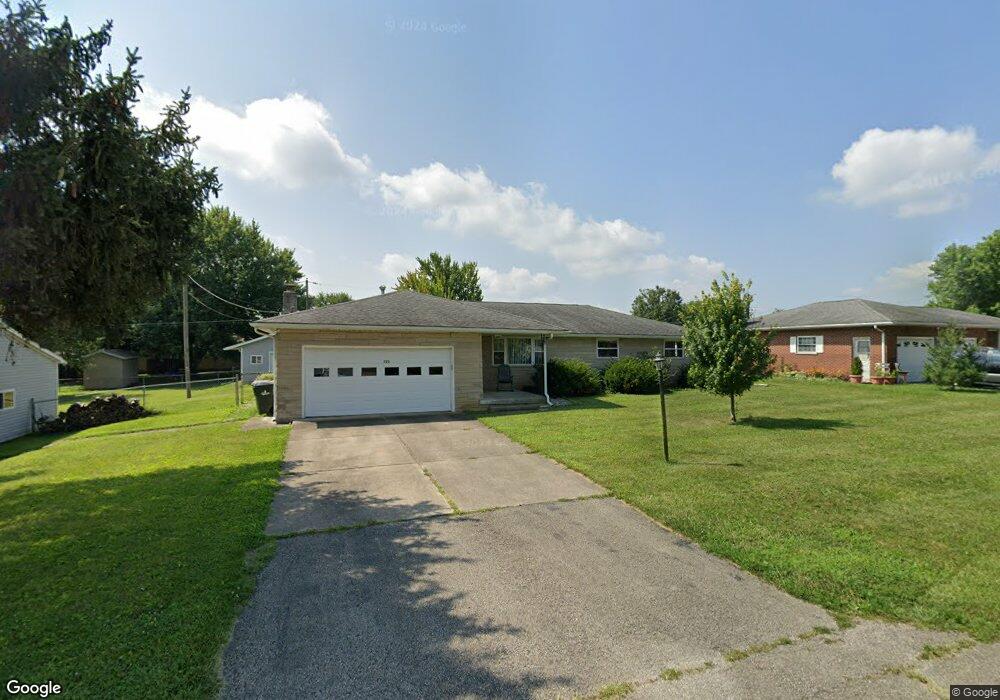
723 W 11th St Greensburg, IN 47240
Estimated Value: $212,000 - $235,000
3
Beds
2
Baths
1,496
Sq Ft
$152/Sq Ft
Est. Value
About This Home
This home is located at 723 W 11th St, Greensburg, IN 47240 and is currently estimated at $227,881, approximately $152 per square foot. 723 W 11th St is a home located in Decatur County with nearby schools including Greensburg Elementary School, Greensburg Community Junior High School, and Greensburg Community High School.
Ownership History
Date
Name
Owned For
Owner Type
Purchase Details
Closed on
Nov 22, 2024
Sold by
Richardson Richard D and Richardson Nancy L
Bought by
Richard D Richardson And Nancy L Richardson L and Richardson
Current Estimated Value
Purchase Details
Closed on
Mar 31, 2014
Sold by
Eric M Eric M
Bought by
Richardson Richard D and Richardson Nancy L
Home Financials for this Owner
Home Financials are based on the most recent Mortgage that was taken out on this home.
Original Mortgage
$90,000
Interest Rate
4.41%
Mortgage Type
Stand Alone First
Purchase Details
Closed on
May 5, 2011
Sold by
Kunz Eugene and Kress Alice G
Bought by
Richardson Eric M
Home Financials for this Owner
Home Financials are based on the most recent Mortgage that was taken out on this home.
Original Mortgage
$100,800
Interest Rate
4.91%
Mortgage Type
Stand Alone First
Create a Home Valuation Report for This Property
The Home Valuation Report is an in-depth analysis detailing your home's value as well as a comparison with similar homes in the area
Home Values in the Area
Average Home Value in this Area
Purchase History
| Date | Buyer | Sale Price | Title Company |
|---|---|---|---|
| Richard D Richardson And Nancy L Richardson L | -- | None Listed On Document | |
| Richard D Richardson And Nancy L Richardson L | -- | None Listed On Document | |
| Richardson Richard D | -- | -- | |
| Richardson Eric M | -- | -- |
Source: Public Records
Mortgage History
| Date | Status | Borrower | Loan Amount |
|---|---|---|---|
| Previous Owner | Richardson Richard D | $90,000 | |
| Previous Owner | Richardson Eric M | $100,800 |
Source: Public Records
Tax History Compared to Growth
Tax History
| Year | Tax Paid | Tax Assessment Tax Assessment Total Assessment is a certain percentage of the fair market value that is determined by local assessors to be the total taxable value of land and additions on the property. | Land | Improvement |
|---|---|---|---|---|
| 2024 | $3,664 | $183,200 | $29,300 | $153,900 |
| 2023 | $3,191 | $166,500 | $30,700 | $135,800 |
| 2022 | $2,934 | $157,100 | $28,100 | $129,000 |
| 2021 | $2,494 | $133,900 | $28,100 | $105,800 |
| 2020 | $2,310 | $124,700 | $28,100 | $96,600 |
| 2019 | $2,120 | $115,400 | $25,800 | $89,600 |
| 2018 | $2,279 | $111,300 | $25,800 | $85,500 |
| 2017 | $2,470 | $121,300 | $25,800 | $95,500 |
| 2016 | $2,383 | $117,400 | $25,800 | $91,600 |
| 2014 | $949 | $117,400 | $29,400 | $88,000 |
| 2013 | $918 | $115,400 | $29,400 | $86,000 |
Source: Public Records
Map
Nearby Homes
- 615 W 11th St
- 721 W 15th St
- 811 W 7th St
- 1712 N Oakmont Ave
- 1314 N Park St
- 1646 N Nieman Dr
- 3075 S Co Rd W
- 2310 N Liberty Lakes Dr
- 2323 N Liberty Lakes Dr
- 2339 N Liberty Lakes Dr
- 2327 N Liberty Lakes Dr
- 210 W 5th St
- 312 W 2nd St
- 314 E Barachel Ln
- 206 W 2nd St
- 529 W 1st St
- 1003 N East St
- 820 N Broadway St
- 1208 N Lincoln St
- 1651 W Independence St