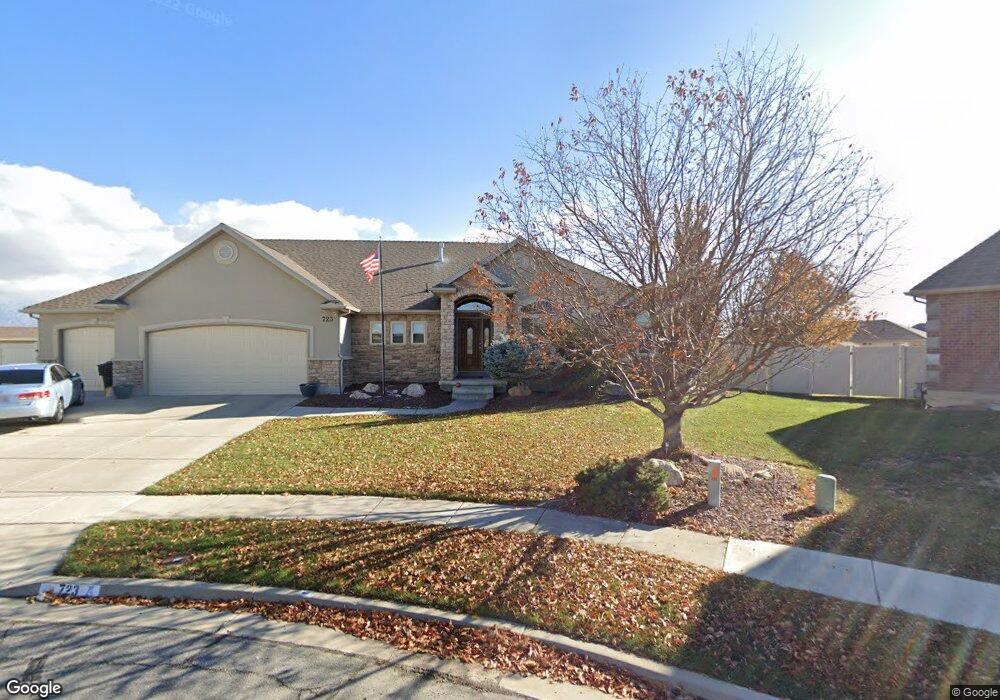
723 W 3400 S Syracuse, UT 84075
Estimated Value: $646,000 - $696,000
3
Beds
2
Baths
3,826
Sq Ft
$174/Sq Ft
Est. Value
About This Home
This home is located at 723 W 3400 S, Syracuse, UT 84075 and is currently estimated at $665,381, approximately $173 per square foot. 723 W 3400 S is a home located in Davis County with nearby schools including Bluff Ridge Elementary, Legacy Junior High School, and Clearfield High School.
Ownership History
Date
Name
Owned For
Owner Type
Purchase Details
Closed on
Aug 12, 2020
Sold by
Baird Dustin and Baird Janell
Bought by
Baird Dustin Alan and Baird Janell
Current Estimated Value
Home Financials for this Owner
Home Financials are based on the most recent Mortgage that was taken out on this home.
Original Mortgage
$258,000
Outstanding Balance
$228,349
Interest Rate
3%
Mortgage Type
New Conventional
Estimated Equity
$437,032
Purchase Details
Closed on
May 19, 2016
Sold by
Breckenridge Prop Fund 2015
Bought by
Baird Dustin and Baird Janell
Purchase Details
Closed on
Dec 11, 2000
Sold by
Rainey Homes Inc
Bought by
Barnard Bruce T and Barnard Christy
Purchase Details
Closed on
Sep 19, 2000
Sold by
Silver Lake Estates Llc
Bought by
Rainey Homes Inc
Home Financials for this Owner
Home Financials are based on the most recent Mortgage that was taken out on this home.
Original Mortgage
$244,000
Interest Rate
8.07%
Mortgage Type
Construction
Create a Home Valuation Report for This Property
The Home Valuation Report is an in-depth analysis detailing your home's value as well as a comparison with similar homes in the area
Home Values in the Area
Average Home Value in this Area
Purchase History
| Date | Buyer | Sale Price | Title Company |
|---|---|---|---|
| Baird Dustin Alan | -- | Pinnacle Title Ins Agency | |
| Baird Dustin | -- | Backman Title | |
| Barnard Bruce T | -- | Heritage West Title Insuranc | |
| Rainey Homes Inc | -- | Bonneville Title Company Inc |
Source: Public Records
Mortgage History
| Date | Status | Borrower | Loan Amount |
|---|---|---|---|
| Open | Baird Dustin Alan | $258,000 | |
| Previous Owner | Rainey Homes Inc | $244,000 |
Source: Public Records
Tax History Compared to Growth
Tax History
| Year | Tax Paid | Tax Assessment Tax Assessment Total Assessment is a certain percentage of the fair market value that is determined by local assessors to be the total taxable value of land and additions on the property. | Land | Improvement |
|---|---|---|---|---|
| 2025 | $3,255 | $314,050 | $144,420 | $169,630 |
| 2024 | $3,171 | $308,000 | $133,365 | $174,635 |
| 2023 | $3,068 | $543,000 | $184,987 | $358,013 |
| 2022 | $3,282 | $318,450 | $104,495 | $213,955 |
| 2021 | $2,823 | $424,000 | $156,061 | $267,939 |
| 2020 | $2,537 | $369,000 | $128,851 | $240,149 |
| 2019 | $2,473 | $355,000 | $134,679 | $220,321 |
| 2018 | $2,302 | $328,000 | $125,309 | $202,691 |
| 2016 | $1,979 | $147,895 | $47,778 | $100,117 |
| 2015 | $2,008 | $142,890 | $47,778 | $95,112 |
| 2014 | $1,928 | $139,813 | $47,778 | $92,035 |
| 2013 | -- | $150,854 | $45,379 | $105,475 |
Source: Public Records
Map
Nearby Homes
- 967 W Yamada Ct
- 567 W 3575 S
- 3169 S 550 W
- 454 N 3550 W
- 1139 W 3150 S
- 3528 S Finch St
- 803 W 2800 S
- 101 S 3600 W
- 3067 S Old Emigrant Rd Unit B
- 2784 S 1720 W Unit F
- 3637 S Creek Side Ln
- 3583 W 200 S
- 3263 W 850 N
- 3535 W Overlook Dr
- 697 N 3275 W
- 2958 S 1320 W
- 2766 S 1200 W
- 1546 W Parkview Dr
- 245 S Summer Breeze Ln
- 1137 W 2500 S