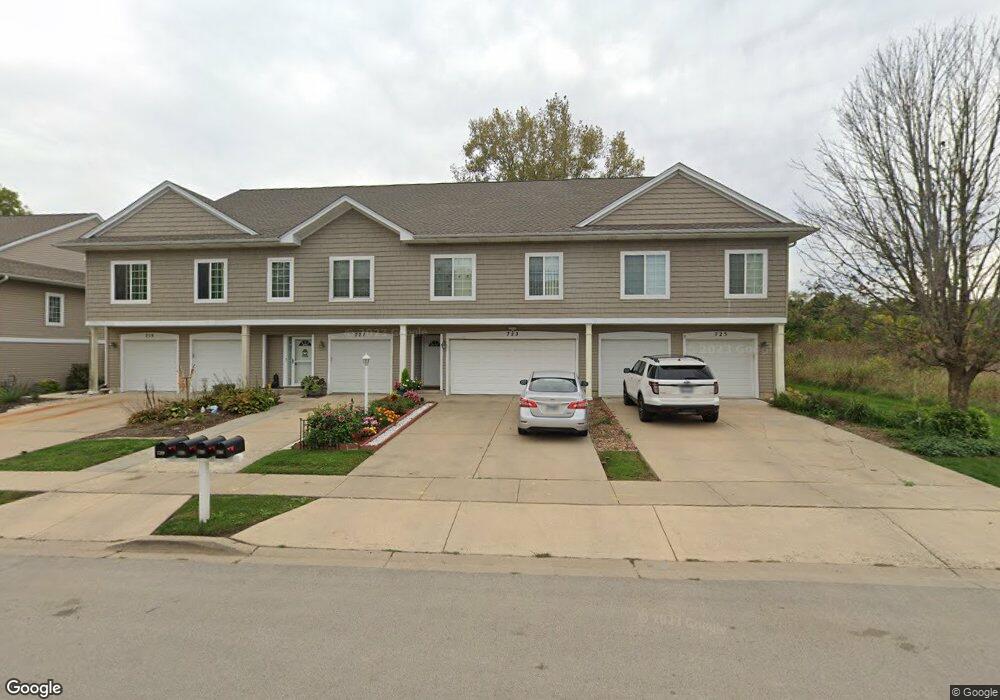
723 W Donovan Ave Unit E Woodstock, IL 60098
Estimated Value: $241,000 - $286,801
2
Beds
3
Baths
1,876
Sq Ft
$141/Sq Ft
Est. Value
About This Home
This home is located at 723 W Donovan Ave Unit E, Woodstock, IL 60098 and is currently estimated at $263,700, approximately $140 per square foot. 723 W Donovan Ave Unit E is a home located in McHenry County with nearby schools including Westwood Elementary School, Creekside Middle School, and Woodstock High School.
Ownership History
Date
Name
Owned For
Owner Type
Purchase Details
Closed on
Feb 21, 2020
Sold by
Duero William T
Bought by
Calleja Cruz Flor G
Current Estimated Value
Home Financials for this Owner
Home Financials are based on the most recent Mortgage that was taken out on this home.
Original Mortgage
$148,555
Outstanding Balance
$130,643
Interest Rate
3.25%
Mortgage Type
FHA
Estimated Equity
$133,057
Purchase Details
Closed on
Mar 24, 2015
Sold by
Steagall S Craig and Steagall Catherine J
Bought by
Duero William T
Home Financials for this Owner
Home Financials are based on the most recent Mortgage that was taken out on this home.
Original Mortgage
$78,400
Interest Rate
2.87%
Mortgage Type
New Conventional
Purchase Details
Closed on
Oct 19, 2009
Sold by
Tall Grass Commons Llc
Bought by
Steagall S Craig and Steagall Catherine J
Purchase Details
Closed on
Sep 16, 2009
Sold by
Donovan Court Llc
Bought by
Tall Grass Commons Llc
Create a Home Valuation Report for This Property
The Home Valuation Report is an in-depth analysis detailing your home's value as well as a comparison with similar homes in the area
Home Values in the Area
Average Home Value in this Area
Purchase History
| Date | Buyer | Sale Price | Title Company |
|---|---|---|---|
| Calleja Cruz Flor G | $152,000 | Attorney | |
| Duero William T | $98,000 | Knight Barry Title Inc | |
| Steagall S Craig | $130,000 | Chicago Title | |
| Tall Grass Commons Llc | $290,000 | Chicago Title Insurance Co |
Source: Public Records
Mortgage History
| Date | Status | Borrower | Loan Amount |
|---|---|---|---|
| Open | Calleja Cruz Flor G | $148,555 | |
| Previous Owner | Duero William T | $78,400 |
Source: Public Records
Tax History Compared to Growth
Tax History
| Year | Tax Paid | Tax Assessment Tax Assessment Total Assessment is a certain percentage of the fair market value that is determined by local assessors to be the total taxable value of land and additions on the property. | Land | Improvement |
|---|---|---|---|---|
| 2024 | $5,969 | $72,783 | $6,416 | $66,367 |
| 2023 | $5,656 | $65,819 | $5,802 | $60,017 |
| 2022 | $5,404 | $58,412 | $5,149 | $53,263 |
| 2021 | $5,126 | $54,576 | $4,811 | $49,765 |
| 2020 | $4,927 | $51,858 | $4,571 | $47,287 |
| 2019 | $4,772 | $49,501 | $4,363 | $45,138 |
| 2018 | $4,169 | $43,406 | $4,977 | $38,429 |
| 2017 | $4,076 | $40,852 | $4,684 | $36,168 |
| 2016 | $4,017 | $37,826 | $4,337 | $33,489 |
| 2013 | -- | $39,742 | $2,544 | $37,198 |
Source: Public Records
Map
Nearby Homes
- 740 Victoria Dr
- 320 W Donovan Ave
- 208 W Greenwood Ave
- 724 Wheeler St
- 431 Washington St
- 814 Robert Dr
- 824 Washington St
- 150 1st St
- 1026 Clay St
- 0 Rt 47 & Lucas Rd Unit MRD12293021
- 233 Arthur Dr
- 914 Pleasant St
- 1546 Wheeler St
- 327 Lincoln Ave
- 13808 Washington St
- 130 Washington St
- 1626 Wheeler St
- 4104 Meadowridge Rd
- 4220 Meadowridge Rd
- 3851 Riverwoods Dr
- 723 W Donovan Ave
- 721 W Donovan Ave
- 721 W Donovan Ave Unit D
- 707 W Donovan Ave Unit F
- 705 W Donovan Ave Unit D
- 703 W Donovan Ave Unit A
- 725 W Donovan Ave
- 719 W Donovan Ave
- 727 W Donovan Ave
- 715 W Donovan Ave
- 715 W Donovan Ave Unit F
- 713 W Donovan Ave
- 713 W Donovan Ave Unit E
- 711 W Donovan Ave
- 711 W Donovan Ave Unit A
- 708 Olive St
- 702 Olive St
- 1 W Donovan Ave
- Lot 1 W Donovan Ave
- 713 Olive St