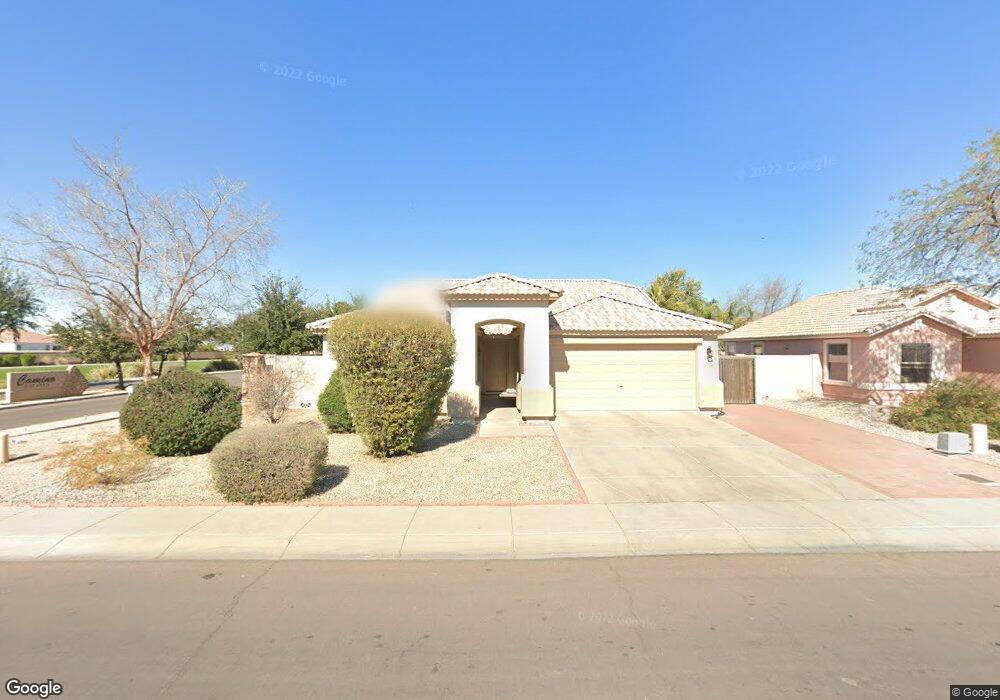
7230 W Claremont St Glendale, AZ 85303
Estimated Value: $331,374 - $430,000
3
Beds
2
Baths
1,810
Sq Ft
$217/Sq Ft
Est. Value
About This Home
This home is located at 7230 W Claremont St, Glendale, AZ 85303 and is currently estimated at $392,844, approximately $217 per square foot. 7230 W Claremont St is a home located in Maricopa County with nearby schools including Desert Garden Elementary School, Challenger Middle School, and Independence High School.
Ownership History
Date
Name
Owned For
Owner Type
Purchase Details
Closed on
Jan 22, 2019
Sold by
Le Tuyet T
Bought by
Kim Le Tuyet T and Kim To Jennifer
Current Estimated Value
Purchase Details
Closed on
Jul 29, 2003
Sold by
To Truc Q
Bought by
Le Tuyet T
Home Financials for this Owner
Home Financials are based on the most recent Mortgage that was taken out on this home.
Original Mortgage
$112,000
Outstanding Balance
$48,133
Interest Rate
5.29%
Mortgage Type
Purchase Money Mortgage
Estimated Equity
$344,711
Purchase Details
Closed on
Aug 21, 2002
Sold by
Richmond American Homes Of Arizona Inc
Bought by
Bell Wendell R and Bell Katherine A
Home Financials for this Owner
Home Financials are based on the most recent Mortgage that was taken out on this home.
Original Mortgage
$143,025
Interest Rate
6.29%
Mortgage Type
FHA
Create a Home Valuation Report for This Property
The Home Valuation Report is an in-depth analysis detailing your home's value as well as a comparison with similar homes in the area
Home Values in the Area
Average Home Value in this Area
Purchase History
| Date | Buyer | Sale Price | Title Company |
|---|---|---|---|
| Kim Le Tuyet T | -- | None Available | |
| Le Tuyet T | -- | Transnation Title Ins Co | |
| Le Tuyet T | $152,000 | Transnation Title Ins Co | |
| Bell Wendell R | $145,271 | Fidelity National Title |
Source: Public Records
Mortgage History
| Date | Status | Borrower | Loan Amount |
|---|---|---|---|
| Open | Le Tuyet T | $112,000 | |
| Closed | Le Tuyet T | $112,000 | |
| Previous Owner | Bell Wendell R | $143,025 |
Source: Public Records
Tax History Compared to Growth
Tax History
| Year | Tax Paid | Tax Assessment Tax Assessment Total Assessment is a certain percentage of the fair market value that is determined by local assessors to be the total taxable value of land and additions on the property. | Land | Improvement |
|---|---|---|---|---|
| 2025 | $1,469 | $12,417 | -- | -- |
| 2024 | $1,332 | $11,826 | -- | -- |
| 2023 | $1,332 | $27,770 | $5,550 | $22,220 |
| 2022 | $1,325 | $20,250 | $4,050 | $16,200 |
| 2021 | $1,319 | $18,660 | $3,730 | $14,930 |
| 2020 | $1,335 | $17,370 | $3,470 | $13,900 |
| 2019 | $1,322 | $15,750 | $3,150 | $12,600 |
| 2018 | $1,267 | $14,550 | $2,910 | $11,640 |
| 2017 | $1,285 | $13,020 | $2,600 | $10,420 |
| 2016 | $1,220 | $12,060 | $2,410 | $9,650 |
| 2015 | $1,150 | $11,470 | $2,290 | $9,180 |
Source: Public Records
Map
Nearby Homes
- 7211 W Claremont St Unit 1
- 6039 N 73rd Ave
- 7181 W Citrus Way
- 7409 W Peck Dr
- 7418 W Peck Dr
- 7438 W Rose Ln
- 7435 W Rose Ln
- 7442 W Rose Ln
- 7424 W Cavalier Dr
- 7445 W Peck Dr
- 7423 W Cavalier Dr
- 7449 W Peck Dr
- 7136 W Palo Verde Dr
- 7138 W Sierra Vista Dr
- 7413 W Peck Dr
- Pinehurst Plan at Bethany Grove
- Sycamore Plan at Bethany Grove
- Grand Plan at Bethany Grove
- Seneca Plan at Bethany Grove
- Shiloh Plan at Bethany Grove
- 7226 W Claremont St
- 7229 W Marlette Ave
- 7222 W Claremont St
- 7225 W Marlette Ave
- 7221 W Marlette Ave
- 7239 W Claremont St
- 7235 W Claremont St
- 7218 W Claremont St
- 7229 W Claremont St
- 7217 W Marlette Ave
- 7301 W Claremont St
- 7214 W Claremont St
- 7223 W Claremont St
- 7217 W I-8
- 7213 W Marlette Ave
- 7222 W Marlette Ave
- 6317 N 73rd Dr
- 7217 W Claremont St
- 6329 N 73rd Dr
- 7210 W Claremont St