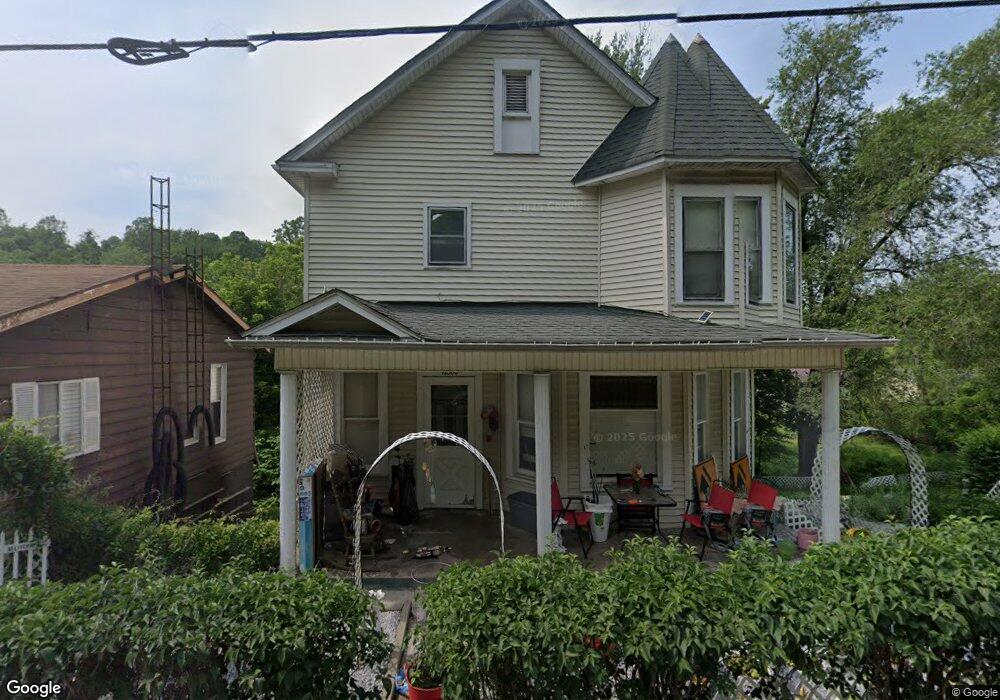
72300 Flushing Holloway Rd Flushing, OH 43977
Estimated Value: $82,000 - $99,000
3
Beds
2
Baths
2,532
Sq Ft
$35/Sq Ft
Est. Value
About This Home
This home is located at 72300 Flushing Holloway Rd, Flushing, OH 43977 and is currently estimated at $88,106, approximately $34 per square foot. 72300 Flushing Holloway Rd is a home located in Belmont County with nearby schools including Union Local Elementary School, Union Local Middle School, and Union Local High School.
Ownership History
Date
Name
Owned For
Owner Type
Purchase Details
Closed on
Aug 19, 2024
Sold by
Gordon Chrystal K
Bought by
Heberlig Rebecca
Current Estimated Value
Home Financials for this Owner
Home Financials are based on the most recent Mortgage that was taken out on this home.
Original Mortgage
$90,808
Outstanding Balance
$89,423
Interest Rate
6.77%
Mortgage Type
New Conventional
Estimated Equity
-$1,317
Purchase Details
Closed on
Dec 19, 2022
Sold by
Gordon Roderick W
Bought by
Gordon Chrystal K
Purchase Details
Closed on
Jun 16, 2021
Bought by
Chrystal K Gordon and Roderic Gordon
Purchase Details
Closed on
Aug 20, 2004
Sold by
Cunard Sheila J and Gordon Chrys
Bought by
Cunard Sheila J and Gordon Chrys
Purchase Details
Closed on
Oct 16, 2003
Sold by
Cunard Sheila J
Bought by
Cunard Sheila J
Purchase Details
Closed on
Jan 1, 1986
Sold by
Campanizzi Emma Mary
Bought by
Campanizzi Emma Mary
Create a Home Valuation Report for This Property
The Home Valuation Report is an in-depth analysis detailing your home's value as well as a comparison with similar homes in the area
Purchase History
| Date | Buyer | Sale Price | Title Company |
|---|---|---|---|
| Heberlig Rebecca | $119,866 | Northwest Title | |
| Gordon Chrystal K | -- | -- | |
| Gordon Chrystal K | -- | None Listed On Document | |
| Chrystal K Gordon | -- | -- | |
| Cunard Sheila J | $48,000 | -- | |
| Cunard Sheila J | -- | -- | |
| Campanizzi Emma Mary | -- | -- |
Source: Public Records
Mortgage History
| Date | Status | Borrower | Loan Amount |
|---|---|---|---|
| Open | Heberlig Rebecca | $90,808 |
Source: Public Records
Tax History
| Year | Tax Paid | Tax Assessment Tax Assessment Total Assessment is a certain percentage of the fair market value that is determined by local assessors to be the total taxable value of land and additions on the property. | Land | Improvement |
|---|---|---|---|---|
| 2025 | $623 | $19,060 | $3,470 | $15,590 |
| 2024 | $598 | $19,060 | $3,470 | $15,590 |
| 2023 | $627 | $18,460 | $3,160 | $15,300 |
| 2022 | $642 | $18,452 | $3,157 | $15,295 |
| 2021 | $640 | $18,452 | $3,157 | $15,295 |
| 2020 | $603 | $18,460 | $3,160 | $15,300 |
| 2019 | $606 | $18,460 | $3,160 | $15,300 |
| 2018 | $570 | $18,460 | $3,160 | $15,300 |
| 2017 | $537 | $15,880 | $1,970 | $13,910 |
| 2016 | $542 | $15,880 | $1,970 | $13,910 |
| 2015 | $559 | $15,880 | $1,970 | $13,910 |
| 2014 | $581 | $16,430 | $1,790 | $14,640 |
| 2013 | $561 | $16,430 | $1,790 | $14,640 |
Source: Public Records
Map
Nearby Homes
- 39775 Rosemary Camp Rd
- 203 Morristown Flushing Rd
- 117 A&B High St
- 0 Pearl St
- 41152 Black Oak Rd
- 0 Holloway Rd State Rt 331 Unit 5067951
- 409 Ashton St
- 34810 Nelson Dr
- 73310 Hazelwood Hills Rd
- 34683 Sunshine Rd
- 35620 Egypt North Rd
- INLOT 19 Havenwood
- 38400 Cadiz-Piedmont Rd
- 77900 Slater Rd
- 34561 Sunshine Rd
- 67380 National New Lafferty Rd
- 67290 National New Lafferty Rd
- 70799 Bannock Uniontown Rd
- 408 W Main St
- 0 National Rd Unit 5154946
- 72300 Flushing Holloway #R Rd
- 72295 Flushing Holloway Rd
- 72314 Flushing Holloway Rd
- 72286 Flushing Holloway Rd
- 39799 Rosemary Camp Rd
- 39815 Rosemary Camp Rd
- 72373 Flushing Holloway Rd
- 72632 Kaczmarek Rd
- 39840 Rosemary Camp Rd
- 72319 Flushing Holloway Rd
- 39678 Poland Rd
- 39851 Rosemary Camp Rd
- 72248 Flushing Holloway Rd
- 72248 Flushing Holloway Rd
- 39865 Rosemary Camp Rd
- 72244 Flushing Holloway Rd
- 39720 Poland Rd
- 39864 Poland Rd
- 72520 Kaczmarek Rd
- 72240 Flushing Holloway Rd
Your Personal Tour Guide
Ask me questions while you tour the home.