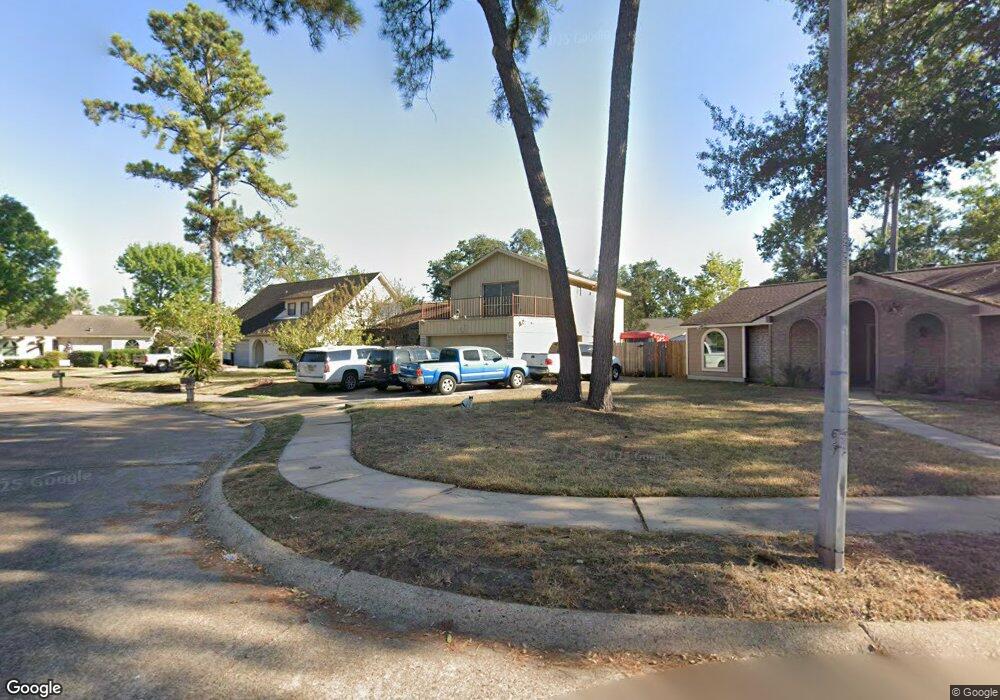
7231 Woodfern Dr Houston, TX 77040
Greater Inwood NeighborhoodEstimated Value: $252,000 - $254,000
4
Beds
2
Baths
2,102
Sq Ft
$120/Sq Ft
Est. Value
About This Home
This home is located at 7231 Woodfern Dr, Houston, TX 77040 and is currently estimated at $252,773, approximately $120 per square foot. 7231 Woodfern Dr is a home located in Harris County with nearby schools including Holbrook Elementary School, Dean Middle School, and Jersey Village High School.
Ownership History
Date
Name
Owned For
Owner Type
Purchase Details
Closed on
Aug 6, 2007
Sold by
Grothe Patrick A and Grothe Jane K
Bought by
Quintanilla Richard A and Quintanilla Regina M
Current Estimated Value
Home Financials for this Owner
Home Financials are based on the most recent Mortgage that was taken out on this home.
Original Mortgage
$112,900
Outstanding Balance
$71,738
Interest Rate
6.73%
Mortgage Type
Purchase Money Mortgage
Estimated Equity
$181,035
Purchase Details
Closed on
May 24, 1995
Sold by
Bailey Dorothy Truitt Rucker and Bailey George John
Bought by
Grothe Patrick A and Grothe Jane K
Home Financials for this Owner
Home Financials are based on the most recent Mortgage that was taken out on this home.
Original Mortgage
$57,600
Interest Rate
8.18%
Purchase Details
Closed on
May 31, 1994
Sold by
Bailey Dorothy Truitt Rucker
Bought by
Bailey George John
Create a Home Valuation Report for This Property
The Home Valuation Report is an in-depth analysis detailing your home's value as well as a comparison with similar homes in the area
Home Values in the Area
Average Home Value in this Area
Purchase History
| Date | Buyer | Sale Price | Title Company |
|---|---|---|---|
| Quintanilla Richard A | -- | Stewart | |
| Grothe Patrick A | -- | American Title Company | |
| Bailey George John | -- | -- |
Source: Public Records
Mortgage History
| Date | Status | Borrower | Loan Amount |
|---|---|---|---|
| Open | Quintanilla Richard A | $112,900 | |
| Previous Owner | Grothe Patrick A | $57,600 | |
| Closed | Grothe Patrick A | $11,500 |
Source: Public Records
Tax History Compared to Growth
Tax History
| Year | Tax Paid | Tax Assessment Tax Assessment Total Assessment is a certain percentage of the fair market value that is determined by local assessors to be the total taxable value of land and additions on the property. | Land | Improvement |
|---|---|---|---|---|
| 2025 | $520 | $222,320 | $60,724 | $161,596 |
| 2024 | $520 | $233,891 | $60,724 | $173,167 |
| 2023 | $520 | $231,804 | $60,724 | $171,080 |
| 2022 | $4,562 | $207,826 | $50,711 | $157,115 |
| 2021 | $4,336 | $167,800 | $50,711 | $117,089 |
| 2020 | $4,420 | $175,338 | $35,350 | $139,988 |
| 2019 | $4,183 | $155,593 | $21,210 | $134,383 |
| 2018 | $1,221 | $137,215 | $21,210 | $116,005 |
| 2017 | $3,800 | $137,215 | $21,210 | $116,005 |
| 2016 | $3,648 | $137,215 | $21,210 | $116,005 |
| 2015 | $2,254 | $128,031 | $17,675 | $110,356 |
| 2014 | $2,254 | $108,864 | $17,675 | $91,189 |
Source: Public Records
Map
Nearby Homes
- 7259 Shady Arbor Ln
- 7218 Stonegate Dr
- 7318 Shady Grove Ln
- 8615 Black Tern Ln
- 6902 Anson Point Ln
- 8610 Twillingate Ln
- 9350 Guywood St
- 9331 Deanwood St
- 7718 Breezeway St
- 6407 Deirdre Anne Dr
- 9523 Vanwood St
- 9207 Loren Ln
- 7051 Majestic Oaks Dr
- 6310 Silver Chalice Dr
- 9214 Woodland Oaks Dr
- 8007 E Oakwood Ct
- 6338 Maple Hill Dr
- 7731 Deadwood Dr
- 7706 Deadwood Dr
- 8020 Oakwood Forest Dr
- 7227 Woodfern Dr
- 7235 Woodfern Dr
- 8723 Landwood Dr
- 8719 Landwood Dr
- 8727 Landwood Dr
- 7223 Woodfern Dr
- 8715 Landwood Dr
- 8803 Landwood Dr
- 7219 Woodfern Dr
- 7230 Woodfern Dr
- 7234 Woodfern Dr
- 7226 Woodfern Dr
- 7238 Woodfern Dr
- 8703 Landwood Dr
- 8807 Landwood Dr
- 7215 Woodfern Dr
- 7222 Woodfern Dr
- 8903 Landwood Dr
- 8726 Landwood Dr
- 8722 Landwood Dr