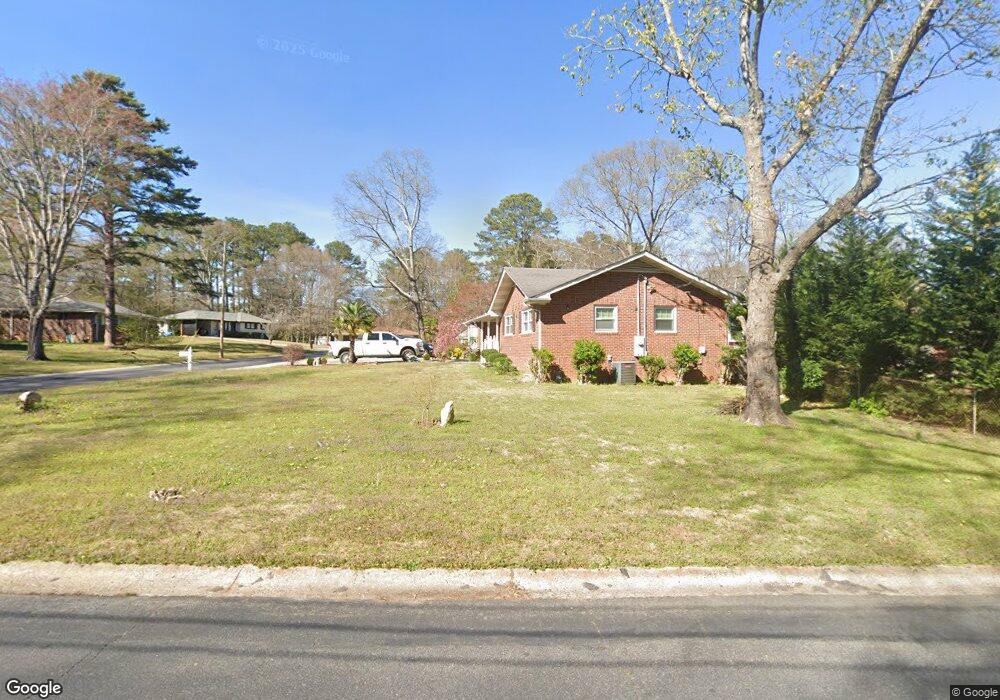
7233 Alicia Way Morrow, GA 30260
Estimated Value: $202,694 - $231,000
2
Beds
3
Baths
1,348
Sq Ft
$158/Sq Ft
Est. Value
About This Home
This home is located at 7233 Alicia Way, Morrow, GA 30260 and is currently estimated at $212,424, approximately $157 per square foot. 7233 Alicia Way is a home located in Clayton County with nearby schools including James Jackson Elementary School, Jonesboro Middle School, and Mount Zion High School.
Ownership History
Date
Name
Owned For
Owner Type
Purchase Details
Closed on
Dec 16, 2019
Sold by
Griff John
Bought by
Green Martin Scott
Current Estimated Value
Home Financials for this Owner
Home Financials are based on the most recent Mortgage that was taken out on this home.
Original Mortgage
$106,684
Outstanding Balance
$93,872
Interest Rate
3.5%
Mortgage Type
FHA
Estimated Equity
$118,552
Purchase Details
Closed on
Aug 31, 2007
Sold by
Hud
Bought by
Griff John
Purchase Details
Closed on
Oct 3, 2006
Sold by
Frye Ronald A
Bought by
Opteum Fins Svcs Llc
Purchase Details
Closed on
Jan 3, 2006
Sold by
Opteum Finl Svcs Llc
Bought by
Hud
Purchase Details
Closed on
Oct 31, 2005
Sold by
Gt Homes Llc
Bought by
Frye Ronald A
Home Financials for this Owner
Home Financials are based on the most recent Mortgage that was taken out on this home.
Original Mortgage
$114,751
Interest Rate
6.04%
Mortgage Type
FHA
Purchase Details
Closed on
May 23, 2005
Sold by
Southside Dev Inc
Bought by
Gt Homes Llc
Home Financials for this Owner
Home Financials are based on the most recent Mortgage that was taken out on this home.
Original Mortgage
$1,131,375
Interest Rate
5.74%
Create a Home Valuation Report for This Property
The Home Valuation Report is an in-depth analysis detailing your home's value as well as a comparison with similar homes in the area
Home Values in the Area
Average Home Value in this Area
Purchase History
| Date | Buyer | Sale Price | Title Company |
|---|---|---|---|
| Green Martin Scott | $112,000 | -- | |
| Griff John | -- | -- | |
| Opteum Fins Svcs Llc | $118,605 | -- | |
| Hud | -- | -- | |
| Frye Ronald A | $115,700 | -- | |
| Gt Homes Llc | $392,000 | -- |
Source: Public Records
Mortgage History
| Date | Status | Borrower | Loan Amount |
|---|---|---|---|
| Open | Green Martin Scott | $106,684 | |
| Previous Owner | Frye Ronald A | $114,751 | |
| Previous Owner | Gt Homes Llc | $1,131,375 |
Source: Public Records
Tax History Compared to Growth
Tax History
| Year | Tax Paid | Tax Assessment Tax Assessment Total Assessment is a certain percentage of the fair market value that is determined by local assessors to be the total taxable value of land and additions on the property. | Land | Improvement |
|---|---|---|---|---|
| 2024 | $2,942 | $84,440 | $6,400 | $78,040 |
| 2023 | $2,900 | $80,320 | $6,400 | $73,920 |
| 2022 | $2,445 | $61,320 | $6,400 | $54,920 |
| 2021 | $1,853 | $45,960 | $6,400 | $39,560 |
| 2020 | $1,643 | $40,140 | $6,400 | $33,740 |
| 2019 | $1,401 | $33,579 | $5,600 | $27,979 |
| 2018 | $1,248 | $29,806 | $5,600 | $24,206 |
| 2017 | $1,015 | $24,016 | $5,600 | $18,416 |
| 2016 | $881 | $20,719 | $5,600 | $15,119 |
| 2015 | $851 | $0 | $0 | $0 |
| 2014 | $801 | $19,194 | $8,400 | $10,794 |
Source: Public Records
Map
Nearby Homes
- 7243 April Ct
- 7104 Georges Way
- 248 Commons Dr
- 7431 Battlecreek Ln
- 7581 Livingston Dr
- 7621 Raleigh Ln
- 7672 Echo Ln
- 7391 Garnet Dr
- 7592 Didwell Ct
- 1608 Bogota Way
- 2158 Weybridge Dr
- 7583 Sunstone Dr
- 139 Cecelia Cir
- 2084 Jadestone Ct
- 1113 Lakeview Dr
- 896 King Rd
- 0 Adamson Pkwy
- 6553 Meadowbrook Ln
- 937 Ohara Dr
- 7233 Alicias Way
- 7231 Alicias Way Unit 202
- 7231 Alicias Way
- 7235 Alicias Way
- 7229 Alicias Way
- 7239 Alicias Way
- 7239 Alicias Way Unit 7239
- 7227 Alicias Way
- 0 Alicias Way Unit 7335295
- 0 Alicias Way Unit 7099553
- 0 Alicias Way Unit 2642476
- 0 Alicias Way Unit 8308929
- 0 Alicias Way Unit 7339315
- 0 Alicias Way Unit 8247724
- 0 Alicias Way Unit 8734121
- 0 Alicias Way Unit 8679696
- 0 Alicias Way Unit 8581598
- 0 Alicias Way Unit 8237617
- 0 Alicias Way Unit 7513902
- 0 Alicias Way Unit 7223594