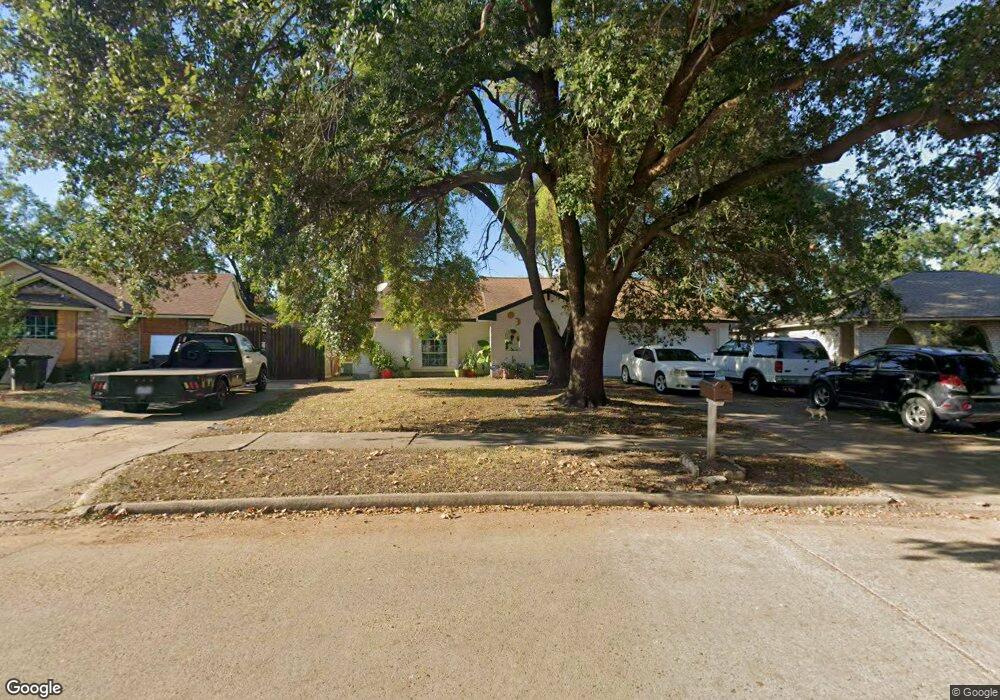
7234 Shady Corners Ln Houston, TX 77040
Greater Inwood NeighborhoodEstimated Value: $217,412 - $234,000
3
Beds
2
Baths
1,523
Sq Ft
$149/Sq Ft
Est. Value
About This Home
This home is located at 7234 Shady Corners Ln, Houston, TX 77040 and is currently estimated at $227,353, approximately $149 per square foot. 7234 Shady Corners Ln is a home located in Harris County with nearby schools including Holbrook Elementary School, Dean Middle School, and Jersey Village High School.
Ownership History
Date
Name
Owned For
Owner Type
Purchase Details
Closed on
Apr 29, 2014
Sold by
Torres Audrey Colleen and Torres Rodolfo
Bought by
Gallegos Eduardo
Current Estimated Value
Home Financials for this Owner
Home Financials are based on the most recent Mortgage that was taken out on this home.
Original Mortgage
$96,224
Outstanding Balance
$74,468
Interest Rate
4.75%
Mortgage Type
FHA
Estimated Equity
$152,885
Purchase Details
Closed on
May 20, 2011
Sold by
Lillei William Robert and Dinovitz Catherine Lilley
Bought by
Cooper Audrey and Bruning Samantha
Home Financials for this Owner
Home Financials are based on the most recent Mortgage that was taken out on this home.
Original Mortgage
$82,354
Interest Rate
5.5%
Mortgage Type
FHA
Purchase Details
Closed on
Oct 25, 2010
Sold by
Lilley William Robert
Bought by
Lilley William Robert and Dinovitz Catherine Lilley
Create a Home Valuation Report for This Property
The Home Valuation Report is an in-depth analysis detailing your home's value as well as a comparison with similar homes in the area
Home Values in the Area
Average Home Value in this Area
Purchase History
| Date | Buyer | Sale Price | Title Company |
|---|---|---|---|
| Gallegos Eduardo | -- | Chicago Title | |
| Cooper Audrey | -- | Startex Title Company 04 | |
| Lilley William Robert | -- | None Available |
Source: Public Records
Mortgage History
| Date | Status | Borrower | Loan Amount |
|---|---|---|---|
| Open | Gallegos Eduardo | $96,224 | |
| Previous Owner | Cooper Audrey | $82,354 |
Source: Public Records
Tax History Compared to Growth
Tax History
| Year | Tax Paid | Tax Assessment Tax Assessment Total Assessment is a certain percentage of the fair market value that is determined by local assessors to be the total taxable value of land and additions on the property. | Land | Improvement |
|---|---|---|---|---|
| 2025 | $2,761 | $202,132 | $61,382 | $140,750 |
| 2024 | $2,761 | $212,160 | $61,382 | $150,778 |
| 2023 | $2,761 | $210,348 | $61,382 | $148,966 |
| 2022 | $4,201 | $188,189 | $51,261 | $136,928 |
| 2021 | $3,993 | $154,522 | $51,261 | $103,261 |
| 2020 | $3,885 | $154,522 | $32,423 | $122,099 |
| 2019 | $3,676 | $136,625 | $19,454 | $117,171 |
| 2018 | $1,029 | $120,586 | $19,454 | $101,132 |
| 2017 | $3,340 | $120,586 | $19,454 | $101,132 |
| 2016 | $3,340 | $120,586 | $19,454 | $101,132 |
| 2015 | $2,734 | $114,113 | $16,212 | $97,901 |
| 2014 | $2,734 | $97,110 | $16,212 | $80,898 |
Source: Public Records
Map
Nearby Homes
- 9350 Guywood St
- 7318 Shady Grove Ln
- 9331 Deanwood St
- 9523 Vanwood St
- 7259 Shady Arbor Ln
- 7051 Majestic Oaks Dr
- 7218 Stonegate Dr
- 7718 Breezeway St
- 8615 Black Tern Ln
- 7706 Deadwood Dr
- 7731 Deadwood Dr
- 9207 Loren Ln
- 6902 Anson Point Ln
- 6407 Deirdre Anne Dr
- 8610 Twillingate Ln
- 9515 Summer Laurel Ln
- 9519 Summer Laurel Ln
- 9214 Woodland Oaks Dr
- 6430 Pirtlewood Cir
- 6310 Silver Chalice Dr
- 7238 Shady Corners Ln
- 7230 Shady Corners Ln
- 7242 Shady Corners Ln
- 7226 Shady Corners Ln
- 7231 Shady Corners Ln
- 7246 Shady Corners Ln
- 7222 Shady Corners Ln
- 7235 Shady Corners Ln
- 7211 Shady Corners Ln
- 7250 Shady Corners Ln
- 7218 Shady Corners Ln
- 7239 Shady Corners Ln
- 7207 Shady Corners Ln
- 7203 Wenwood Cir
- 7254 Shady Corners Ln
- 7251 Shady Corners Ln
- 7247 Shady Corners Ln
- 9334 Guywood St
- 7214 Shady Corners Ln
- 9243 Landwood Dr