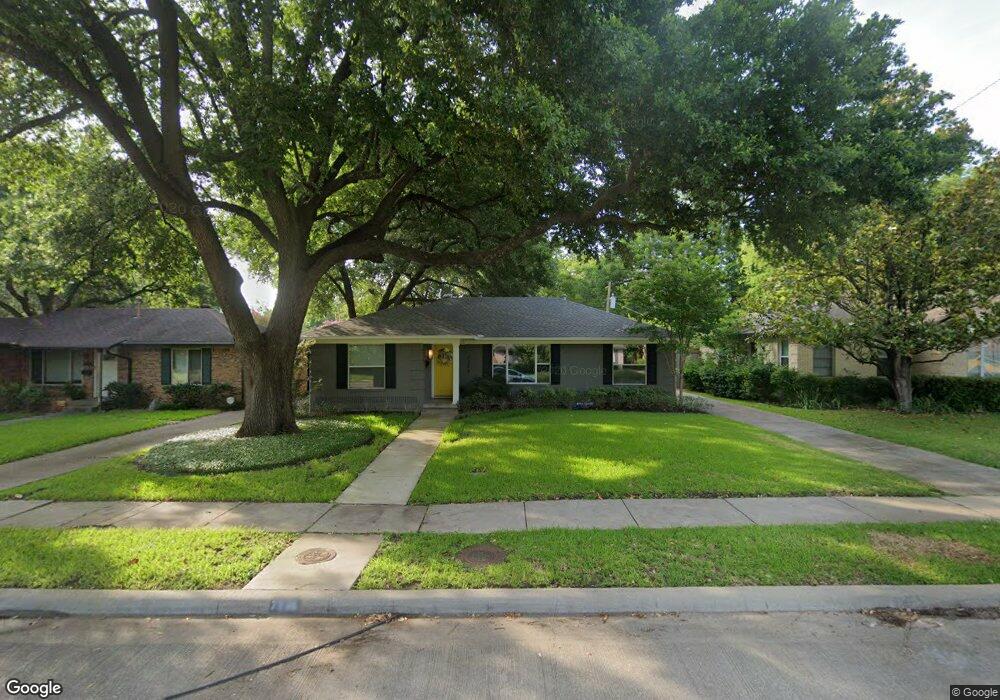
7236 Dalewood Ln Dallas, TX 75214
Northeast Dallas NeighborhoodEstimated Value: $620,000 - $703,000
2
Beds
2
Baths
1,410
Sq Ft
$472/Sq Ft
Est. Value
About This Home
This home is located at 7236 Dalewood Ln, Dallas, TX 75214 and is currently estimated at $664,888, approximately $471 per square foot. 7236 Dalewood Ln is a home located in Dallas County with nearby schools including Lakewood Elementary School, J L Long Middle School, and Woodrow Wilson High School.
Ownership History
Date
Name
Owned For
Owner Type
Purchase Details
Closed on
Apr 30, 2015
Sold by
Fant John F and Fant Melony D
Bought by
Yarborough Ben A and Yarborough Rebeca F
Current Estimated Value
Home Financials for this Owner
Home Financials are based on the most recent Mortgage that was taken out on this home.
Original Mortgage
$228,000
Outstanding Balance
$85,406
Interest Rate
3.84%
Mortgage Type
New Conventional
Estimated Equity
$579,482
Purchase Details
Closed on
May 30, 2012
Sold by
King Barbara and Fair Barbara King
Bought by
Fant John F and Fant Melody
Home Financials for this Owner
Home Financials are based on the most recent Mortgage that was taken out on this home.
Original Mortgage
$138,500
Interest Rate
3.93%
Mortgage Type
New Conventional
Purchase Details
Closed on
Jul 31, 1995
Sold by
Wofford Irma M
Bought by
King Barbara
Create a Home Valuation Report for This Property
The Home Valuation Report is an in-depth analysis detailing your home's value as well as a comparison with similar homes in the area
Home Values in the Area
Average Home Value in this Area
Purchase History
| Date | Buyer | Sale Price | Title Company |
|---|---|---|---|
| Yarborough Ben A | -- | None Available | |
| Fant John F | -- | Tpt | |
| King Barbara | -- | -- |
Source: Public Records
Mortgage History
| Date | Status | Borrower | Loan Amount |
|---|---|---|---|
| Open | Yarborough Ben A | $228,000 | |
| Previous Owner | Fant John F | $138,500 |
Source: Public Records
Tax History Compared to Growth
Tax History
| Year | Tax Paid | Tax Assessment Tax Assessment Total Assessment is a certain percentage of the fair market value that is determined by local assessors to be the total taxable value of land and additions on the property. | Land | Improvement |
|---|---|---|---|---|
| 2025 | $10,346 | $787,550 | $400,000 | $387,550 |
| 2024 | $10,346 | $668,730 | $290,000 | $378,730 |
| 2023 | $10,346 | $626,710 | $290,000 | $336,710 |
| 2022 | $12,469 | $498,670 | $260,000 | $238,670 |
| 2021 | $10,829 | $410,510 | $260,000 | $150,510 |
| 2020 | $11,137 | $410,510 | $260,000 | $150,510 |
| 2019 | $11,380 | $399,980 | $260,000 | $139,980 |
| 2018 | $10,929 | $401,930 | $150,000 | $251,930 |
| 2017 | $8,007 | $294,460 | $150,000 | $144,460 |
| 2016 | $7,219 | $265,490 | $125,000 | $140,490 |
| 2015 | $6,449 | $237,770 | $90,000 | $147,770 |
| 2014 | $6,449 | $235,120 | $90,000 | $145,120 |
Source: Public Records
Map
Nearby Homes
- 7325 Rutgers Dr
- 7329 Dalewood Ln
- 6925 Galemeadow Cir
- 7147 E Mockingbird Ln
- 7220 Haverford Rd
- 7328 Rockhurst Dr
- 7318 Rockhurst Dr
- 7127 E Mockingbird Ln
- 7130 Brookcove Ln
- 7232 Syracuse Dr
- 7231 Syracuse Dr
- 7496 E Northwest Hwy Unit 145
- 7456 E Northwest Hwy Unit 125
- 7462 E Northwest Hwy Unit 128
- 6811 Patrick Dr
- 7126 Edgerton Dr
- 6984 Santa Barbara Dr
- 6717 Pimlico Dr
- 6660 Santa Anita Dr
- 6665 Santa Anita Dr
- 7230 Dalewood Ln
- 7226 Dalewood Ln
- 7246 Dalewood Ln
- 7237 Westbrook Ln
- 7233 Westbrook Ln
- 7243 Westbrook Ln
- 7237 Dalewood Ln
- 7233 Dalewood Ln
- 7222 Dalewood Ln
- 7227 Westbrook Ln
- 7247 Westbrook Ln
- 7227 Dalewood Ln
- 7243 Dalewood Ln
- 7223 Westbrook Ln
- 7223 Dalewood Ln
- 7247 Dalewood Ln
- 7216 Dalewood Ln
- 7306 Dalewood Ln
- 7219 Dalewood Ln
- 7219 Westbrook Ln